HOT TOPICS LIST
- MACD
- Fibonacci
- RSI
- Gann
- ADXR
- Stochastics
- Volume
- Triangles
- Futures
- Cycles
- Volatility
- ZIGZAG
- MESA
- Retracement
- Aroon
INDICATORS LIST
LIST OF TOPICS
PRINT THIS ARTICLE
by Chaitali Mohile
The Dow Jones Utility Average has traveled a long distance from the low pivot. Let us analyze the breakout direction.
Position: N/A
Chaitali Mohile
Active trader in the Indian stock markets since 2003 and a full-time writer. Trading is largely based upon technical analysis.
PRINT THIS ARTICLE
BREAKOUTS
$UTIL Trapped In Narrow Range
02/24/11 01:35:06 PMby Chaitali Mohile
The Dow Jones Utility Average has traveled a long distance from the low pivot. Let us analyze the breakout direction.
Position: N/A
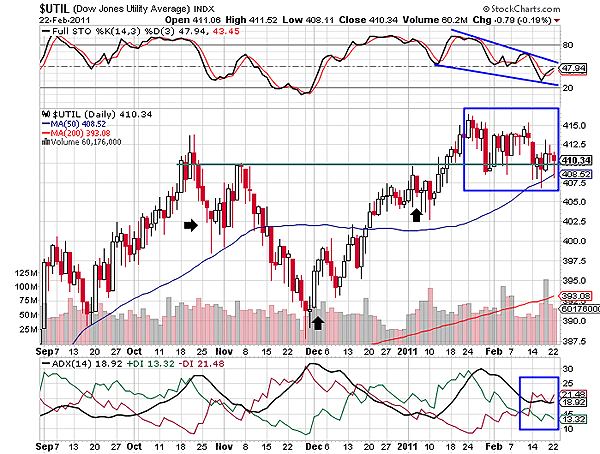
| An inverted head & shoulders pattern is visible on the daily time frame of the Dow Jones Utility Average ($UTIL) in Figure 1. Due to the high volatility in a pullback rally from 387 levels, the formation of the right shoulder of the pattern was a little tricky. A bullish breakout of the trend reversal pattern successfully reversed the previous bearish trend of $UTIL. As the index approached the neckline resistance at 409 levels, the descending average directional index (ADX) (14) surged above 20 levels with huge buying pressure. However, the breakout could not travel more than 10 to 15 points from the neckline support. The full stochastic (14,3,3) failed to sustain in an overbought zone, indicating a weak momentum in the breakout rally. |

|
| FIGURE 1: $UTIL, DAILY. During the volatile consolidation, the neckline and the MA support have been challenged by $UTIL. |
| Graphic provided by: StockCharts.com. |
| |
| As a result, $UTIL moved sideways. According to Figure 1, the index has been consolidating in a very narrow range for almost a month. The various red candles and the upper and lower shadows of the white show robust volatility. Recently, the index has tested the 50-day moving average (MA) support. Therefore, the neckline and the MA are the two major supports for $UTIL. The index has to sustain above these supports to maintain the bullish levels. Currently, the chart is filled with many doji candlesticks and the ADX (14) is just a few points away from 20 levels, which would develop a fresh downtrend for $UTIL. The declining stochastic oscillator has slipped below the 50 levels, suggesting the developing weakness. |

|
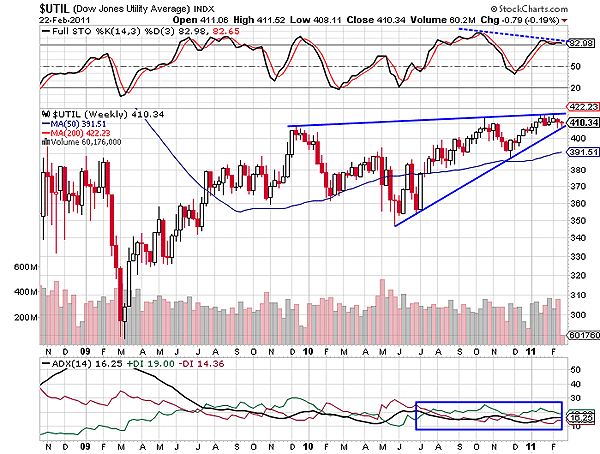
| FIGURE 2: $UTIL, WEEKLY. The breakout direction of the index is unknown. |
| Graphic provided by: StockCharts.com. |
| |
| The series of higher highs and higher lows has formed a triangle on the weekly time frame in Figure 2. This triangle is not an ascending triangle, as the upper trendline is ascending along with the lower trendline. Both trendlines have converged, and therefore, the pattern is ready to break out. The index has moved in a highly narrow range. Since the pattern is a symmetrical triangle, we cannot judge the breakout direction for $UTIL. The momentum oscillator shows a negative divergence, signifying huge bearish pressure in the index. The ADX (14) is moving in a very tight range between the 15 and 16 levels, indicating the volatile consolidation ahead. It also does not suggest any breakout direction. |
| Both charts are filled with the bearish pressures. Therefore, only the actual breakout would tell us the direction of the future rally. Traders should wait for the confirmed breakout, as the high volatility could whipsaw you. |
Active trader in the Indian stock markets since 2003 and a full-time writer. Trading is largely based upon technical analysis.
| Company: | Independent |
| Address: | C1/3 Parth Indraprasth Towers. Vastrapur |
| Ahmedabad, Guj 380015 | |
| E-mail address: | chaitalimohile@yahoo.co.in |
Traders' Resource Links | |
| Independent has not added any product or service information to TRADERS' RESOURCE. | |
Click here for more information about our publications!
PRINT THIS ARTICLE

Request Information From Our Sponsors
- StockCharts.com, Inc.
- Candle Patterns
- Candlestick Charting Explained
- Intermarket Technical Analysis
- John Murphy on Chart Analysis
- John Murphy's Chart Pattern Recognition
- John Murphy's Market Message
- MurphyExplainsMarketAnalysis-Intermarket Analysis
- MurphyExplainsMarketAnalysis-Visual Analysis
- StockCharts.com
- Technical Analysis of the Financial Markets
- The Visual Investor
- VectorVest, Inc.
- Executive Premier Workshop
- One-Day Options Course
- OptionsPro
- Retirement Income Workshop
- Sure-Fire Trading Systems (VectorVest, Inc.)
- Trading as a Business Workshop
- VectorVest 7 EOD
- VectorVest 7 RealTime/IntraDay
- VectorVest AutoTester
- VectorVest Educational Services
- VectorVest OnLine
- VectorVest Options Analyzer
- VectorVest ProGraphics v6.0
- VectorVest ProTrader 7
- VectorVest RealTime Derby Tool
- VectorVest Simulator
- VectorVest Variator
- VectorVest Watchdog
