HOT TOPICS LIST
- MACD
- Fibonacci
- RSI
- Gann
- ADXR
- Stochastics
- Volume
- Triangles
- Futures
- Cycles
- Volatility
- ZIGZAG
- MESA
- Retracement
- Aroon
INDICATORS LIST
LIST OF TOPICS
PRINT THIS ARTICLE
by Billy Williams
Trading pullbacks lets you get better entries than momentum trading alone, but you need to know what patterns to look for.
Position: Hold
Billy Williams
Billy Williams has been trading the markets for 27 years, specializing in momentum trading with stocks and options.
PRINT THIS ARTICLE
CHART ANALYSIS
Price Pattern Signals For Pullback Trading
02/24/11 01:14:10 PMby Billy Williams
Trading pullbacks lets you get better entries than momentum trading alone, but you need to know what patterns to look for.
Position: Hold
| Dave Landry, a former hedge fund manager, once remarked that his style of pullback trading was like "momentum trading but with better entries," given the method's ability to make low-risk entries into a fast-moving stock. Trading pullbacks in the stock market is one of the tried-and-true trading approaches in professional speculation, but the drawbacks are that many traders don't know what to look for to make an accurate entry into a stock. Fortunately, there are a few simple price patterns that you can look for within the price action itself to find an entry and that allow the momentum of the stock to trigger your position. First, you have to set some parameters to help give you a reference point as to when the stock is displaying the right amount of velocity and when a pullback draws back in price with just the right amount of depth. |

|
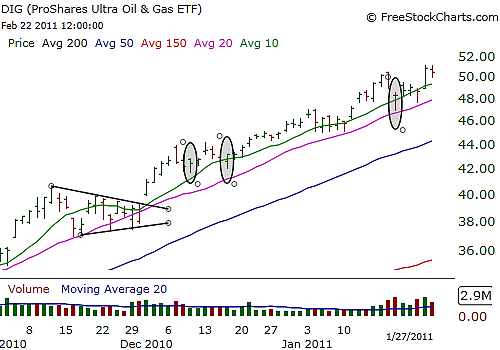
| FIGURE 1: DIG. DIG offered several price patterns for entry points, starting with an entry that traded below the low of the two previous price bars and then repeated a few days later. Later, an entry was triggered after price traded down two consecutive days while also trading below the two previous trading days' daily lows. |
| Graphic provided by: www.freestockcharts.com. |
| |
| Use a combination of 10-, 20-, and 30-day simple moving averages (SMAs) on your price chart. For a bullish trend, the moving averages should be stacked in the proper order with the 10-day SMA on top of the 20-day SMA, which is on top of the 30-day SMA. For a bearish trend, the reverse is true where the 10-day is trading below the 20-day SMA, which is below the 30-day SMA. When price trades back into the 10-day SMA or the 20-day SMA, begin looking for a price pattern to emerge, which reveals that the dominant trend in place is about to resume. One of the price patterns to keep watch for are a series of two to five price bars that close consecutively lower in a bullish trend or higher in a bearish trend without closing beyond the 30-day SMA. This price pattern reveals that traders are taking profits and the stock's price is consolidating, but not enough to reverse the current velocity in the direction of the trend. Look for the price bar that makes the significant low in this series, and when price trades up over the high of that bar, enter a position with a stop below that bar's price low. See Figure 1. |

|
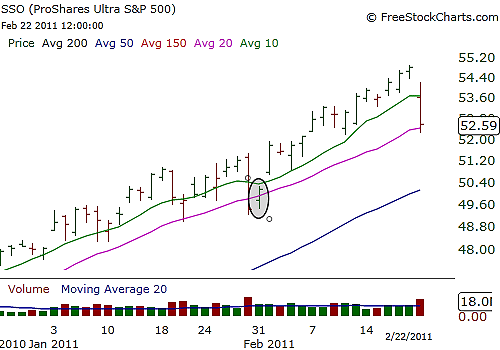
| FIGURE 2: SSO. SSO formed an inside bar just off the 20-day SMA, offering you an entry back in the direction of the primary uptrend. |
| Graphic provided by: www.freestockcharts.com. |
| |
| Inside bars are another viable price pattern that reveals a pause in the pullback's direction, revealing that traders are consolidating their trade position because they are unsure of the current short-term direction or the current pullback's direction is stalling due to a lack of trading volume to reverse the larger primary trend. Using this price pattern as an entry point, you want to enter as price trades over the high of this price bar in a bullish trend or below the low in a bearish trend. Stops are placed on opposite ends of the inside bar's daily range, depending on whether it was a bullish or bearish entry point. Remember, if price trades beyond the 30-day SMA, the setup is void. Another significant price pattern is a pullback where a price bar's significant low trades below the low of the two previous bars in a bullish trend or the price bar's significant high, which trades above the high of the two previous bars in a bearish trend. This pattern is a quick pause in the direction of the primary trend and is a strong pattern that allows you to latch on to the current trend with relatively low risk. Like the previous patterns detailed, enter above the high or low of the price bar, making the significant high or low given whatever the primary trend is in play, placing a stop on the opposite end of the price bar's daily range while keeping mindful that if the price bar extends the 30-day SMA, then the entry is voided. See Figure 2. |
| These are solid price patterns to be used for pullback trading, but also remember that these patterns can work together in combination. A stock's price bar in a bullish trend can trade down two consecutive days in a row while forming an inside bar at the same time and still count as a valid entry point, provided that the SMA parameters are respected with regard to the setup. This only adds to the strength of the entry, so don't allow yourself to be thrown off by these patterns working in tandem with one another. Always respect risk and use stop-loss orders to avoid overexposure. |
Billy Williams has been trading the markets for 27 years, specializing in momentum trading with stocks and options.
| Company: | StockOptionSystem.com |
| E-mail address: | stockoptionsystem.com@gmail.com |
Traders' Resource Links | |
| StockOptionSystem.com has not added any product or service information to TRADERS' RESOURCE. | |
Click here for more information about our publications!
Comments
Date: 03/01/11Rank: 5Comment:

Request Information From Our Sponsors
- StockCharts.com, Inc.
- Candle Patterns
- Candlestick Charting Explained
- Intermarket Technical Analysis
- John Murphy on Chart Analysis
- John Murphy's Chart Pattern Recognition
- John Murphy's Market Message
- MurphyExplainsMarketAnalysis-Intermarket Analysis
- MurphyExplainsMarketAnalysis-Visual Analysis
- StockCharts.com
- Technical Analysis of the Financial Markets
- The Visual Investor
- VectorVest, Inc.
- Executive Premier Workshop
- One-Day Options Course
- OptionsPro
- Retirement Income Workshop
- Sure-Fire Trading Systems (VectorVest, Inc.)
- Trading as a Business Workshop
- VectorVest 7 EOD
- VectorVest 7 RealTime/IntraDay
- VectorVest AutoTester
- VectorVest Educational Services
- VectorVest OnLine
- VectorVest Options Analyzer
- VectorVest ProGraphics v6.0
- VectorVest ProTrader 7
- VectorVest RealTime Derby Tool
- VectorVest Simulator
- VectorVest Variator
- VectorVest Watchdog
