HOT TOPICS LIST
- MACD
- Fibonacci
- RSI
- Gann
- ADXR
- Stochastics
- Volume
- Triangles
- Futures
- Cycles
- Volatility
- ZIGZAG
- MESA
- Retracement
- Aroon
INDICATORS LIST
LIST OF TOPICS
PRINT THIS ARTICLE
by Alan R. Northam
Here, the simple crossing of the closing price above or below a moving average is tested as a viable trading system.
Position: N/A
Alan R. Northam
Alan Northam lives in the Dallas, Texas area and as an electronic engineer gave him an analytical mind from which he has developed a thorough knowledge of stock market technical analysis. His abilities to analyze the future direction of the stock market has allowed him to successfully trade of his own portfolio over the last 30 years. Mr. Northam is now retired and trading the stock market full time. You can reach him at inquiry@tradersclassroom.com or by visiting his website at http://www.tradersclassroom.com. You can also follow him on Twitter @TradersClassrm.
PRINT THIS ARTICLE
TRADING SYSTEMS
Simple Moving Average Trading System
02/24/11 08:51:51 AMby Alan R. Northam
Here, the simple crossing of the closing price above or below a moving average is tested as a viable trading system.
Position: N/A
| We often see or use exponential moving averages (EMAs) to represent lines of support or resistance. When the closing price of a security closes above a certain moving average, we say that the moving average has turned into a line of support, and when the closing price crosses below a moving average, we say that the moving average has now become a line of resistance. If moving averages can take on the role of support and resistance once the price of a security closes above or below them, does this also mean that, as traders, we should be able to buy and sell on these same crossings and make a profit? To perform this test, I have used three popular stock market indexes and three popular time frames. The three indexes I have chosen are the Dow Jones Industrial Average (DJIA), the Standard & Poor's 500, and the NASDAQ. The three time frames are the 200-, 50-, and 20-day periods. For this test, I will also use the popular EMA (other moving averages were also tested with similar results). The test was run from January 1, 2000, to January 1, 2011, a 12-year period. The test was to buy when the market closed above the moving average and to sell when the market closed below the moving average. The commissions used per trade was $10. |
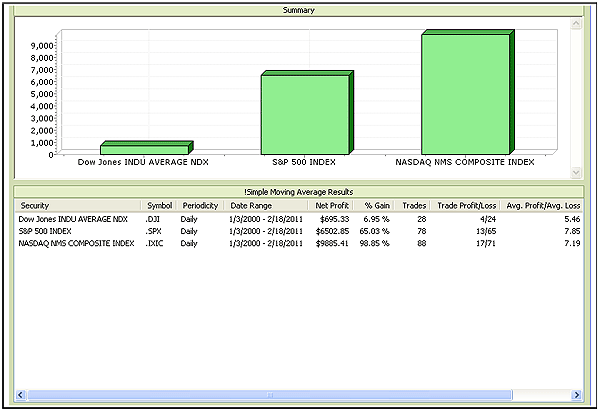
| Figure 1 shows the results using the 200-day EMA. The DJIA made a profit of 6.95% over this 12-year time frame with 28 trades; four trades were profitable and 24 trades were losers. The ratio of the average profit to average loss was 5.46, meaning that the average profit was over five times larger than the average loss. The S&P 500 made a profit of 65.03% over this 12-year time frame with 78 trades; 13 trades were profitable and 65 trades were losers. The ratio of the average profit to average loss was 7.85, meaning that the average profit were almost eight times larger than the average loss. The NASDAQ, however, performed the best over this time period, with a profit of 98.85% over this 12-year time frame with 88 trades; 17 trades were profitable and 71 trades were losers. The ratio of the average profit to average loss was 7.19, meaning that the average profit was about seven times larger than the average loss. While all three indexes produces a profit over this 12-year time frame, with the DJIA just barely eking out a gain, less than a quarter of the trades were winners, with the majority of trades being losers. |

|
| FIGURE 1: 200-DAY. Here's a trading system using a 200-day exponential moving average. |
| Graphic provided by: MetaStock. |
| |
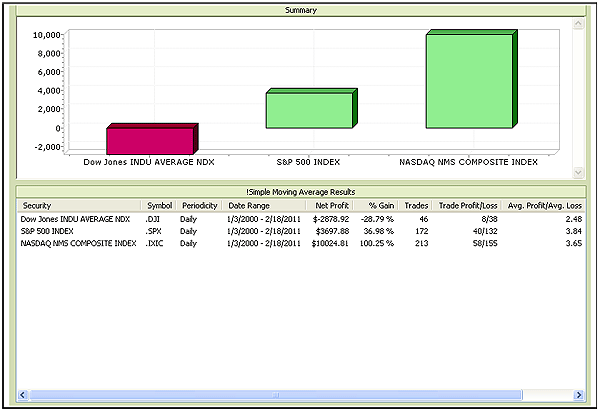
| Figure 2 shows the results of the test using the 50-day EMA. Over this time frame, the DJIA had a loss of 28.79% over 46 trades; eight trades were profitable and 38 trades were losers. The ratio of the average profit to average loss was 2.48, meaning that the average profit was approximately 2.5 five times larger than the average loss. The S&P 500 made a profit of 36.98% over this 12-year time frame on a total of 172 trades; 40 trades were profitable and 132 trades were losers. The ratio of the average profit to average loss was 3.84. The NASDAQ, however, again performed the best over this time period with a profit of 100.25% over this 12-year time frame on 213 trades, of which 58 trades were profitable and 155 trades were losers. The ratio of the average profit to average loss was 3.65. Over this shorter time frame the DJIA lost money, and the S&P 500 made about half the profit it did over the 200-day time frame with twice the trades. The NASDAQ, however, made about the same profit as it did over the 200-day time frame but took two and a half times as many trades to do so. Over the two time frames, the 200-day time frame was the better time frame to trade. |

|
| FIGURE 2: 50-DAY. Here's a trading system using a 50-day exponential moving average. |
| Graphic provided by: MetaStock. |
| |
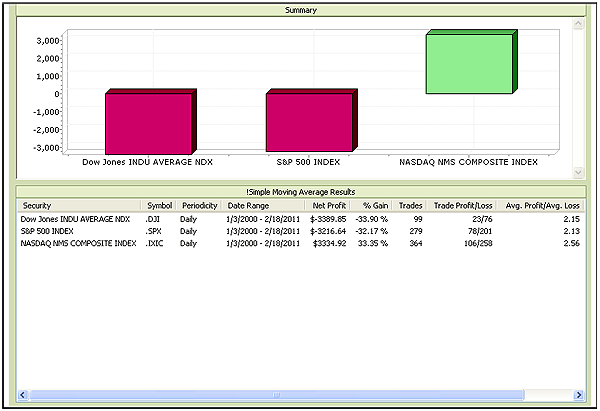
| Figure 3 shows the results of the test using the 20-day EMA. Over this time frame, the DJIA had a loss of 33.9% over 99 trades; 23 trades were profitable and 76 trades were losers. The ratio of the average profit to average loss was 2.15. The S&P 500 also had a loss over this shortest time from losing 32.17% on 279 trades, of which 78 trades were profitable and 201 trades were losers. The ratio of the average profit to average loss was 2.13. The NASDAQ, however, again came out a winner over this time period with a profit of 33.35% on 364 trades, of which 106 trades were profitable and 258 trades were losers. The ratio of the average profit to average loss was 2.56. Over this shortest of time frames, both the DJIA and the S&P lost money. While the NASDAQ made money, it only made a third of the profit it did using the 50-day time frame and it took 50% more trades to do so. |

|
| FIGURE 3: 20-DAY. Here's a trading system using a 20-day exponential moving average. |
| Graphic provided by: MetaStock. |
| |
| The results of this test show that there is great variability as to whether a particular index or security would generate a profit using the crossing of the closing price above or below a moving average to trigger buy and sell signals. Of the three time frames used in this test, the 200-day time frame performed the best. However, even using this time frame does not guarantee a reasonable profit over the long term -- to wit, the DJIA. In conclusion, using the crossing of the closing price of a security and a single moving average of any time frame as a trading system is an extremely poor trading system, at best with a very low probability of generating a profit for the trader. |
Alan Northam lives in the Dallas, Texas area and as an electronic engineer gave him an analytical mind from which he has developed a thorough knowledge of stock market technical analysis. His abilities to analyze the future direction of the stock market has allowed him to successfully trade of his own portfolio over the last 30 years. Mr. Northam is now retired and trading the stock market full time. You can reach him at inquiry@tradersclassroom.com or by visiting his website at http://www.tradersclassroom.com. You can also follow him on Twitter @TradersClassrm.
| Garland, Tx | |
| Website: | www.tradersclassroom.com |
| E-mail address: | inquiry@tradersclassroom.com |
Click here for more information about our publications!
Comments

Request Information From Our Sponsors
- StockCharts.com, Inc.
- Candle Patterns
- Candlestick Charting Explained
- Intermarket Technical Analysis
- John Murphy on Chart Analysis
- John Murphy's Chart Pattern Recognition
- John Murphy's Market Message
- MurphyExplainsMarketAnalysis-Intermarket Analysis
- MurphyExplainsMarketAnalysis-Visual Analysis
- StockCharts.com
- Technical Analysis of the Financial Markets
- The Visual Investor
- VectorVest, Inc.
- Executive Premier Workshop
- One-Day Options Course
- OptionsPro
- Retirement Income Workshop
- Sure-Fire Trading Systems (VectorVest, Inc.)
- Trading as a Business Workshop
- VectorVest 7 EOD
- VectorVest 7 RealTime/IntraDay
- VectorVest AutoTester
- VectorVest Educational Services
- VectorVest OnLine
- VectorVest Options Analyzer
- VectorVest ProGraphics v6.0
- VectorVest ProTrader 7
- VectorVest RealTime Derby Tool
- VectorVest Simulator
- VectorVest Variator
- VectorVest Watchdog
