HOT TOPICS LIST
- MACD
- Fibonacci
- RSI
- Gann
- ADXR
- Stochastics
- Volume
- Triangles
- Futures
- Cycles
- Volatility
- ZIGZAG
- MESA
- Retracement
- Aroon
INDICATORS LIST
LIST OF TOPICS
PRINT THIS ARTICLE
by Donald W. Pendergast, Jr.
Shares of C.H. Robinson began faltering well in advance of the recent stall in the S&P 500 and have now issued a very strong sell signal.
Position: Sell
Donald W. Pendergast, Jr.
Donald W. Pendergast is a financial markets consultant who offers specialized services to stock brokers and high net worth individuals who seek a better bottom line for their portfolios.
PRINT THIS ARTICLE
TRADING SYSTEMS
CHRW Weak Relative Strength, Strong Sell Signal
02/23/11 09:30:25 AMby Donald W. Pendergast, Jr.
Shares of C.H. Robinson began faltering well in advance of the recent stall in the S&P 500 and have now issued a very strong sell signal.
Position: Sell
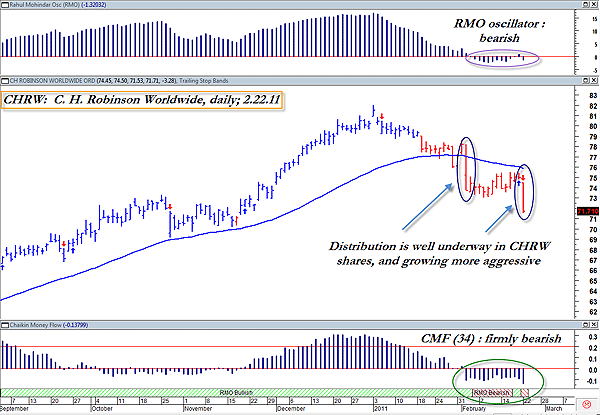
| C.H. Robinson (CHRW) is a major player in the North American trucking industry, and its common shares have enjoyed a steady, if not spectacular, rise since the major market low of March 2009. Now, however, the stock is giving definite confirmation of a significant trend reversal -- one that could still have some more downside before major support kicks in. Figure 1 is a look at the daily chart of CHRW. |

|
| FIGURE 1: CHRW, DAILY. Although it may seem counterintuitive to novice traders, sometimes the wisest choice is to sell into weakness when an existing bearish trend move continues lower. |
| Graphic provided by: MetaStock. |
| Graphic provided by: Rahul Mohindar RMO indicators from MetaStock 11. |
| |
| The Rahul Mohindar (RMO) swing trading system is hard at work again; here, it's just issued a daily sell signal for CHRW, one occurring on super wide range and big volume. Note how the stock staged a similar bearish break lower (slicing right through the 50-day exponential moving average [EMA]) just a couple of weeks earlier, even before the major US stock indexes started to turn lower. This time, money flow (the 34-period Chaikin money flow histogram at the bottom of the chart) is even weaker and the RMO oscillator (top of chart) is still stuck beneath its zero line as the RMO swing trading system flashes yet another sell signal -- the third one in less than two months. |
| Of all of Tuesday's RMO swing sell signals for Standard & Poor's 500 component stocks, CHRW has one of the weakest relative strength rankings versus the index over the past 13 weeks, making this sell signal of even greater interest; it already has strong downside momentum pushing it lower, which is exactly what you want to see if planning to short a stock, buy put options on it, or even sell naked calls against it. For conservative traders, buying some at-the-money (ATM) puts might make the most sense here, as long as they realize that the stock has support coming up near $69.15, $66.76, and then at $64.30. One strategy might be to wait for a modest intraday pullback higher before buying such puts (if such a pullback occurs, that is) and then using one of the aforementioned price targets as your official exit point, depending on how bearish you really are. A three- to four-bar trailing stop of the daily highs, or even a simple nine-period moving average, might help provide some guidance for an initial/trailing stop should this stock continue to head south as anticipated. |
| Traders and investors need to pay more attention to their charts and trading systems as they do to the daily dose of bad news on the tube and the Internet. Be aware of what's going on in the world around us, by all means, but don't get distracted from what your proven systems and strategies are telling you to do. The RMO swing trading system in MetaStock 11 is surely one of the better trading systems of recent years, and perhaps you will find it to be of major worth to you in your trading endeavors. |
Donald W. Pendergast is a financial markets consultant who offers specialized services to stock brokers and high net worth individuals who seek a better bottom line for their portfolios.
| Title: | Writer, market consultant |
| Company: | Linear Trading Systems LLC |
| Jacksonville, FL 32217 | |
| Phone # for sales: | 904-239-9564 |
| E-mail address: | lineartradingsys@gmail.com |
Traders' Resource Links | |
| Linear Trading Systems LLC has not added any product or service information to TRADERS' RESOURCE. | |
Click here for more information about our publications!
PRINT THIS ARTICLE

Request Information From Our Sponsors
- StockCharts.com, Inc.
- Candle Patterns
- Candlestick Charting Explained
- Intermarket Technical Analysis
- John Murphy on Chart Analysis
- John Murphy's Chart Pattern Recognition
- John Murphy's Market Message
- MurphyExplainsMarketAnalysis-Intermarket Analysis
- MurphyExplainsMarketAnalysis-Visual Analysis
- StockCharts.com
- Technical Analysis of the Financial Markets
- The Visual Investor
- VectorVest, Inc.
- Executive Premier Workshop
- One-Day Options Course
- OptionsPro
- Retirement Income Workshop
- Sure-Fire Trading Systems (VectorVest, Inc.)
- Trading as a Business Workshop
- VectorVest 7 EOD
- VectorVest 7 RealTime/IntraDay
- VectorVest AutoTester
- VectorVest Educational Services
- VectorVest OnLine
- VectorVest Options Analyzer
- VectorVest ProGraphics v6.0
- VectorVest ProTrader 7
- VectorVest RealTime Derby Tool
- VectorVest Simulator
- VectorVest Variator
- VectorVest Watchdog
