HOT TOPICS LIST
- MACD
- Fibonacci
- RSI
- Gann
- ADXR
- Stochastics
- Volume
- Triangles
- Futures
- Cycles
- Volatility
- ZIGZAG
- MESA
- Retracement
- Aroon
INDICATORS LIST
LIST OF TOPICS
PRINT THIS ARTICLE
by Koos van der Merwe
Today, there is more gold out of the ground than is in the ground.
Position: Buy
Koos van der Merwe
Has been a technical analyst since 1969, and has worked as a futures and options trader with First Financial Futures in Johannesburg, South Africa.
PRINT THIS ARTICLE
ELLIOTT WAVE
More Gold Out Than There Is In
02/23/11 09:24:00 AMby Koos van der Merwe
Today, there is more gold out of the ground than is in the ground.
Position: Buy
| We all know that gold is a safe haven. Whether money flows to gold as a protection against inflation or for any other reason, gold is king. With today's gold exchange traded funds (ETFs), it is so much easier to hedge a portfolio with gold shares today than it was in the past. Many analysts are calling for gold to rise to $5,000, a round figure that seems to have been sucked out of the air. What this does show is that no one really knows how high gold could rise. We can only guess. I have been so wrong recently with my analysis of where the gold price is going to that I am almost scared to give an analysis. However, after a number of emails asking me where I think gold going, I must give it another try. |

|
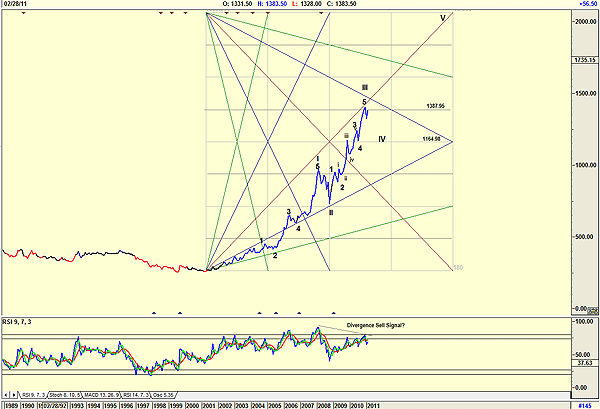
| FIGURE 1: GOLD, MONTHLY |
| Graphic provided by: AdvancedGET. |
| |
| Figure 1 is a monthly chart of London gold. The Elliott wave count on a Gann square is suggesting that gold could be in a wave IV, which could see it drop to the 1164.98 level. This is confirmed by the relative strength index (RSI), which does look as though it is giving a divergence sell signal. This does seem strange. With all the unrest in the world, one would think money would be moving to gold and the chart would suggest strength. Then again, the price could move higher, with the RSI following, a move that is saying that gold is close to a top, but has not turned yet. |

|
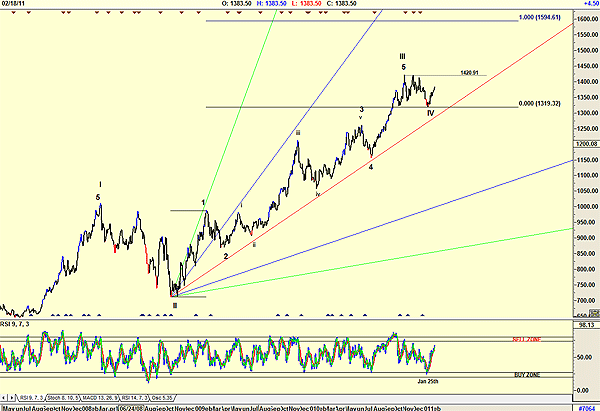
| FIGURE 2: GOLD, DAILY |
| Graphic provided by: AdvancedGET. |
| |
| Figure 2 suggests that gold could start rising, probably to retest the pivot point at 1420.91. This is confirmed by the RSI, which is rising after giving a buy signal on January 25. How high can gold go? Once the gold price has broken above the 1420.91 resistance, it could start as a test for the Fibonacci extension level of 1594.61. Any move above this level could see it move to 1732.26 (1.5%) or 1764.74 (1.618) levels, not shown on the chart. How high can gold go? At the moment it is anybody's guess. Money will always look for a safe haven. Look for ETFs that invest in gold. With mining expenses rising, buying a mine can bring in unexpected risks. |
Has been a technical analyst since 1969, and has worked as a futures and options trader with First Financial Futures in Johannesburg, South Africa.
| Address: | 3256 West 24th Ave |
| Vancouver, BC | |
| Phone # for sales: | 6042634214 |
| E-mail address: | petroosp@gmail.com |
Click here for more information about our publications!
Comments
Date: 03/01/11Rank: 3Comment: I would have liked a bit more fleshing-out , but reasonably stimulating.

Request Information From Our Sponsors
- StockCharts.com, Inc.
- Candle Patterns
- Candlestick Charting Explained
- Intermarket Technical Analysis
- John Murphy on Chart Analysis
- John Murphy's Chart Pattern Recognition
- John Murphy's Market Message
- MurphyExplainsMarketAnalysis-Intermarket Analysis
- MurphyExplainsMarketAnalysis-Visual Analysis
- StockCharts.com
- Technical Analysis of the Financial Markets
- The Visual Investor
- VectorVest, Inc.
- Executive Premier Workshop
- One-Day Options Course
- OptionsPro
- Retirement Income Workshop
- Sure-Fire Trading Systems (VectorVest, Inc.)
- Trading as a Business Workshop
- VectorVest 7 EOD
- VectorVest 7 RealTime/IntraDay
- VectorVest AutoTester
- VectorVest Educational Services
- VectorVest OnLine
- VectorVest Options Analyzer
- VectorVest ProGraphics v6.0
- VectorVest ProTrader 7
- VectorVest RealTime Derby Tool
- VectorVest Simulator
- VectorVest Variator
- VectorVest Watchdog
