HOT TOPICS LIST
- MACD
- Fibonacci
- RSI
- Gann
- ADXR
- Stochastics
- Volume
- Triangles
- Futures
- Cycles
- Volatility
- ZIGZAG
- MESA
- Retracement
- Aroon
INDICATORS LIST
LIST OF TOPICS
PRINT THIS ARTICLE
by Billy Williams
Momentum trading leads to fast gains but also to missed opportunities, unless you have a good backup strategy, like pullback trading.
Position: Hold
Billy Williams
Billy Williams has been trading the markets for 27 years, specializing in momentum trading with stocks and options.
PRINT THIS ARTICLE
MOVING AVERAGES
Momentum And Pullbacks
02/23/11 11:34:55 AMby Billy Williams
Momentum trading leads to fast gains but also to missed opportunities, unless you have a good backup strategy, like pullback trading.
Position: Hold
| When a stock explodes out of a consolidated price base or a chart pattern, the move can be dramatic, since the stock has a tendency to quickly run from the trader who is unprepared. Price can skyrocket, sometimes making gains of 20% or more before pausing and forming another consolidation pattern. For the trader who times the move perfectly, this can lead to an early position that can turn into a 50% or more gain anywhere from a few days to a few months, depending on the price acceleration. However, for the trader who misses the move or for a part-time trader who can't watch the market all day, this can be a problem. |
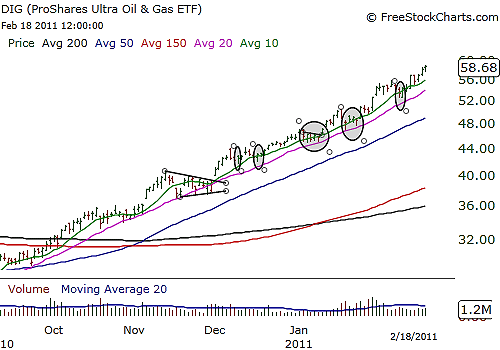
| The primary problem this presents for the trader who misses the move is a missed opportunity to improve their returns, build their trading capital, and, worse, feeds into a growing sense of discouragement or a blow to the confidence of the trader. This leads to the secondary problem, and one could argue the more important of the two, is that due to a sense of dread at the prospect of a missed opportunity that could lead to these negative feelings, it can result in the trader trying to chase the trade to avoid experiencing these negative feelings. Trading is as much a mental game as a process and the mindset of the participant is a crucial factor when preparing for the challenge of successful trading. Fortunately, if you have a backup strategy, then you avoid both of these outcomes and still profit handsomely. See Figure 1. |

|
| FIGURE 1: DIG. DIG broke out of a bullish triangle on a huge gap in price that you could have missed. However, by using SMAs and simple price pullbacks, you could have entered several times, with momentum letting you ride the trend higher. |
| Graphic provided by: www.freestockcharts.com. |
| |
| Momentum trading can lead to some serious gains, but even the best momentum traders miss the occasional breakaway move. However, by using a set of simple indicators like moving averages and price patterns, you can often get a better entry point with improved risk control as a side benefit. When price explodes out of a price pattern, for example, it can be a challenge as to where to put your stop-loss order. Do you put it under the price base? Do you use a simple 8% profit loss as your stop-loss point? Do you place the stop under the price bar that broke out above the resistance level? These are all questions that you, as a trader, must know before putting on the trade. |
| When using a pullback strategy, placing stop-loss orders is rather black & white in that you just place it under the pivot low. For long entries, it's even easier to let momentum confirm when you pull the trigger, as price will pull back to the moving averages and then you place your stop over the top of the price bar that makes the significant pivot low. When the trend resumes back to the upside, you allow momentum to trade back up over the high of that price bar, triggering your long position and then ride the trend up. For shorts, you just do the inverse. |
| Use a combination of 10-, 20-, and 50-day simple moving averages (SMAs) to help you determine the trend and act as a visual reference when considering an entry. If the SMAs are all stacked in the proper order and trading upward, then you have a confirmed bullish trend to trade and, conversely, a bearish trend if all conditions are met in the opposite. Wait for price to pull back to the 10- or 20-day SMA making a shallow pullback for viable entry points, but if price closes below the 20-day SMA, then the setup is void. |
Billy Williams has been trading the markets for 27 years, specializing in momentum trading with stocks and options.
| Company: | StockOptionSystem.com |
| E-mail address: | stockoptionsystem.com@gmail.com |
Traders' Resource Links | |
| StockOptionSystem.com has not added any product or service information to TRADERS' RESOURCE. | |
Click here for more information about our publications!
Comments
Date: 03/01/11Rank: 5Comment:

Request Information From Our Sponsors
- StockCharts.com, Inc.
- Candle Patterns
- Candlestick Charting Explained
- Intermarket Technical Analysis
- John Murphy on Chart Analysis
- John Murphy's Chart Pattern Recognition
- John Murphy's Market Message
- MurphyExplainsMarketAnalysis-Intermarket Analysis
- MurphyExplainsMarketAnalysis-Visual Analysis
- StockCharts.com
- Technical Analysis of the Financial Markets
- The Visual Investor
- VectorVest, Inc.
- Executive Premier Workshop
- One-Day Options Course
- OptionsPro
- Retirement Income Workshop
- Sure-Fire Trading Systems (VectorVest, Inc.)
- Trading as a Business Workshop
- VectorVest 7 EOD
- VectorVest 7 RealTime/IntraDay
- VectorVest AutoTester
- VectorVest Educational Services
- VectorVest OnLine
- VectorVest Options Analyzer
- VectorVest ProGraphics v6.0
- VectorVest ProTrader 7
- VectorVest RealTime Derby Tool
- VectorVest Simulator
- VectorVest Variator
- VectorVest Watchdog
