HOT TOPICS LIST
- MACD
- Fibonacci
- RSI
- Gann
- ADXR
- Stochastics
- Volume
- Triangles
- Futures
- Cycles
- Volatility
- ZIGZAG
- MESA
- Retracement
- Aroon
INDICATORS LIST
LIST OF TOPICS
PRINT THIS ARTICLE
by Ranjan Jha, CMT
The defense stocks are showing resilience despite on and off talk of budget cuts.
Position: N/A
Ranjan Jha, CMT
I am a member of the Market Technicians Association and manage a limited partnership investment club in Virginia. Always seek advice from your own Financial Advisor before acting on any method outlined here since every circumstance is different.
PRINT THIS ARTICLE
CHART ANALYSIS
Defense Stocks On The Offensive
02/22/11 08:47:33 AMby Ranjan Jha, CMT
The defense stocks are showing resilience despite on and off talk of budget cuts.
Position: N/A
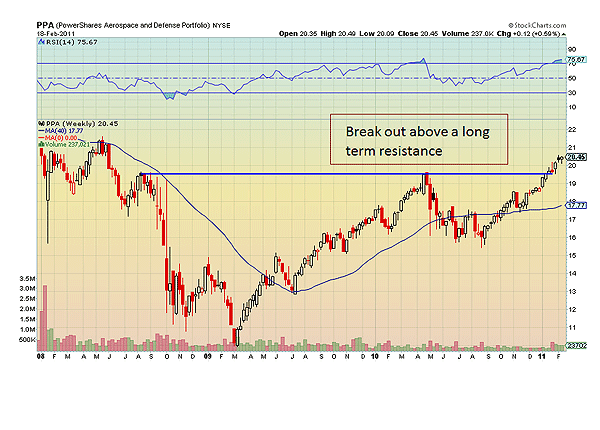
| PowerShares Aerospace & Defense ETF (PPA) consists of Boeing, Honeywell, United Technologies, General Dynamics, Lockheed Martin, and other defense names. As discord over the next budget is gaining speed in Congress, it appears that no one is after defense spending as much as it was feared before. The recent price action of PPA seems to confirm that view. Figure 1 shows a weekly chart of PPA. It shows how defense stocks as a group are performing. Recently, it has cleared a resistance near $20 from August 2008, which it failed to surpass in April 2010. Since then, the price has stayed above that mark. |

|
| FIGURE 1: PPA, WEEKLY. Itís trading above both near-term and long-term resistance. |
| Graphic provided by: StockCharts.com. |
| |
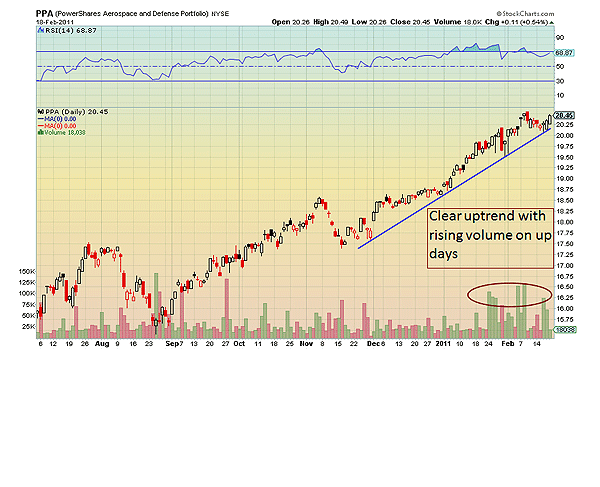
| We can take a closer look at day-to-day price action of PPA in Figure 2. The uptrend line since late November 2010 is firmly in place. The surge in volume on up days in the past several days is encouraging. In addition, since the beginning of 2011, the relative strength index (RSI)(14) became overbought. More than often, the RSI bounces roughly between the 40-50 and 70-80 range for an uptrending stock. Such action is more significant when it's supported by rising volume. |

|
| FIGURE 2: PPA EXCHANGE TRADED FUND, DAILY. Lately, PPA had several up sessions with relatively higher volume. |
| Graphic provided by: StockCharts.com. |
| |
| Technical analysis generally has higher odds of success when it's in sync with the fundamental conditions. Large fund managers must be sensing that Congress may not target the defense budget after all. In addition, defense companies draw significant revenue from international sales. For example, Boeing, which caters to nondefense markets as well, makes more than 40% of its sales in the international markets. Now, you may decide on position sizing and stop-loss based on your time frame and risk appetite, but the intermediate-term technical signals with supportive fundamentals indicate that PPA has a good probability of trending higher. |
I am a member of the Market Technicians Association and manage a limited partnership investment club in Virginia. Always seek advice from your own Financial Advisor before acting on any method outlined here since every circumstance is different.
| Address: | 2039 Stone Mill Drive |
| Salem, VA 24153 | |
| Phone # for sales: | 540-330-2911 |
| E-mail address: | ranjanjha@hotmail.com |
Click here for more information about our publications!
Comments

Request Information From Our Sponsors
- StockCharts.com, Inc.
- Candle Patterns
- Candlestick Charting Explained
- Intermarket Technical Analysis
- John Murphy on Chart Analysis
- John Murphy's Chart Pattern Recognition
- John Murphy's Market Message
- MurphyExplainsMarketAnalysis-Intermarket Analysis
- MurphyExplainsMarketAnalysis-Visual Analysis
- StockCharts.com
- Technical Analysis of the Financial Markets
- The Visual Investor
- VectorVest, Inc.
- Executive Premier Workshop
- One-Day Options Course
- OptionsPro
- Retirement Income Workshop
- Sure-Fire Trading Systems (VectorVest, Inc.)
- Trading as a Business Workshop
- VectorVest 7 EOD
- VectorVest 7 RealTime/IntraDay
- VectorVest AutoTester
- VectorVest Educational Services
- VectorVest OnLine
- VectorVest Options Analyzer
- VectorVest ProGraphics v6.0
- VectorVest ProTrader 7
- VectorVest RealTime Derby Tool
- VectorVest Simulator
- VectorVest Variator
- VectorVest Watchdog
