HOT TOPICS LIST
- MACD
- Fibonacci
- RSI
- Gann
- ADXR
- Stochastics
- Volume
- Triangles
- Futures
- Cycles
- Volatility
- ZIGZAG
- MESA
- Retracement
- Aroon
INDICATORS LIST
LIST OF TOPICS
PRINT THIS ARTICLE
by Koos van der Merwe
Okay, so it's not breakfast, but it is a cup & handle formation, with coffee? Bagels still to come.
Position: Accumulate
Koos van der Merwe
Has been a technical analyst since 1969, and has worked as a futures and options trader with First Financial Futures in Johannesburg, South Africa.
PRINT THIS ARTICLE
ELLIOTT WAVE
Breakfast At Tiffany's
02/22/11 08:37:37 AMby Koos van der Merwe
Okay, so it's not breakfast, but it is a cup & handle formation, with coffee? Bagels still to come.
Position: Accumulate
| Audrey Hepburn in the movie "Breakfast At Tiffany's" made an already famous jewelry store even more famous when the movie came out back in 1961. But Tiffany and Co. (TIF) was only listed in 1990, and the store is still one of the most expensive there is, so why, when the economy is not that good, has the share price suddenly started to rise dramatically? Are people buying more expensive jewelry all of a sudden? Whatever the answer, a look at the chart tells us a great deal of where we can expect the market to go. |

|
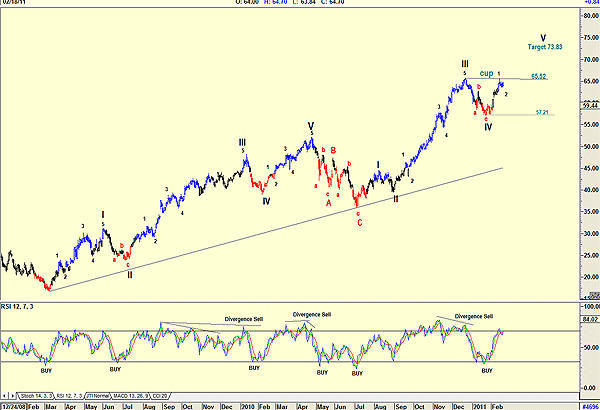
| FIGURE 1: TIFFANY'S, DAILY |
| Graphic provided by: AdvancedGET. |
| |
| Figure 1 shows an Elliott wave count that suggests the share price is moving in a wave 2 of a wave V. This is confirmed by the relative strength index (RSI), which is at overbought levels. A look at previous RSI signals does show a divergent sell as a more likely sell signal. However, the chart does show a cup & handle formation developing with a target of $73.83 (65.52 - 57.21 = 8.31 + 65.52 = 73.83). Of course, this will only happen should the price break above the handle at $65.52. The chart is telling us that wave V should top out at $73.83, which is $9.13 away from the present level. This is 14% higher from its present level. Does this mean we could see the market move 14% higher before the expected market correction? It looks like it. Until then, enjoy your breakfast at Tiffany's. |
Has been a technical analyst since 1969, and has worked as a futures and options trader with First Financial Futures in Johannesburg, South Africa.
| Address: | 3256 West 24th Ave |
| Vancouver, BC | |
| Phone # for sales: | 6042634214 |
| E-mail address: | petroosp@gmail.com |
Click here for more information about our publications!
Comments

Request Information From Our Sponsors
- StockCharts.com, Inc.
- Candle Patterns
- Candlestick Charting Explained
- Intermarket Technical Analysis
- John Murphy on Chart Analysis
- John Murphy's Chart Pattern Recognition
- John Murphy's Market Message
- MurphyExplainsMarketAnalysis-Intermarket Analysis
- MurphyExplainsMarketAnalysis-Visual Analysis
- StockCharts.com
- Technical Analysis of the Financial Markets
- The Visual Investor
- VectorVest, Inc.
- Executive Premier Workshop
- One-Day Options Course
- OptionsPro
- Retirement Income Workshop
- Sure-Fire Trading Systems (VectorVest, Inc.)
- Trading as a Business Workshop
- VectorVest 7 EOD
- VectorVest 7 RealTime/IntraDay
- VectorVest AutoTester
- VectorVest Educational Services
- VectorVest OnLine
- VectorVest Options Analyzer
- VectorVest ProGraphics v6.0
- VectorVest ProTrader 7
- VectorVest RealTime Derby Tool
- VectorVest Simulator
- VectorVest Variator
- VectorVest Watchdog
