HOT TOPICS LIST
- MACD
- Fibonacci
- RSI
- Gann
- ADXR
- Stochastics
- Volume
- Triangles
- Futures
- Cycles
- Volatility
- ZIGZAG
- MESA
- Retracement
- Aroon
INDICATORS LIST
LIST OF TOPICS
PRINT THIS ARTICLE
by Jamie Theiss
Here's an example of why the 200-period simple moving average is so powerful.
Position: Buy
Jamie Theiss
Jamie Theiss is a full-time trader who daytrades stocks, swing trades forex, and from time to time position trades commodities.
PRINT THIS ARTICLE
SIMPLE MA
The Mighty 200-Period Simple Moving Average
02/18/11 10:41:09 AMby Jamie Theiss
Here's an example of why the 200-period simple moving average is so powerful.
Position: Buy
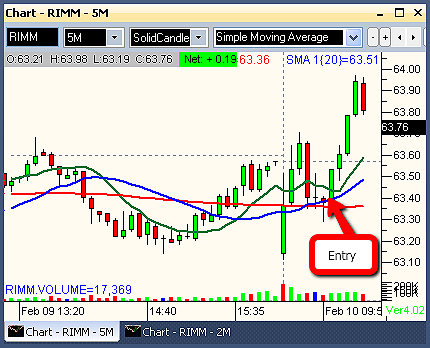
| The 200-period simple moving average (SMA) is so widely followed, it is almost a self-fulfilling price point of support and resistance. The power of it is almost magical, especially if it is used in conjunction with other indicators. An excellent example could be found in a recent trade in RIMM. The setup is a basic buying of the pullback. This powerful setup was a combination of an event, at a location, at a market reaction time. See Figure 1. |

|
| FIGURE 1: RIMM, FIVE-MINUTE. Note how the flat 200-day SMA (red) halts the pullback. Entry is $0.01 over the red bottoming tail bar and the stop is $0.01 below it. |
| Graphic provided by: Blackwood Pro. |
| |
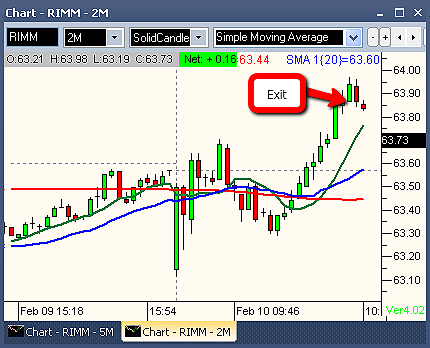
| At the open of the market there were three nice green bars that filled the gap. This bullish action was followed by a predictable pullback. The mighty 200-day SMA support (red) was tested and immediately put in a bottoming tail. The next bar was a follow-through bar as soon as it took out the high of the previous bottoming tail bar. Our entry was $0.01 over that bottoming tail bar at $63.42. Our protective stop was $0.01 below the low of that bar at $63.28. That gives us a risk of only $0.14. Using $100, for example, as our risk per trade, we enter with 700 shares. Usually, we use a five-minute bar-by-bar break as our exit strategy. However, the five-minute bars started to get quite extended and nearly vertical so we dropped down to the two-minute chart and used a two-minute bar-by-bar break for our exit. Our exit strategy was hit at $63.86, leaving us with a $0.44 profit on 700 shares, or about $308 as our profit -- a nice 3:1 risk/reward trade. See Figure 2. |

|
| FIGURE 2: RIMM, TWO-MINUTE. As the five-minute bars were getting extended, I dropped down to the two-minute chart and used a bar-by-bar break as my exit strategy. |
| Graphic provided by: Blackwood Pro. |
| |
| The power of the 200-day SMA is unparalleled, especially when used in combination with other indicators. We had an event, a bottoming tail and reversal bar follow-through. We had a location, the flat 200-day SMA, in conjunction with the 10 o'clock reaction time of the market. Being mindful of position size correctly with regards to the risk per trade leaves us with the resulting winning trade. Look back at previous charts and it becomes apparent that the 200-day SMA is a simple but powerful line of support and resistance. It would be wise to give it the respect it deserves. |
Jamie Theiss is a full-time trader who daytrades stocks, swing trades forex, and from time to time position trades commodities.
| E-mail address: | jamie_theiss@yahoo.com |
Click here for more information about our publications!
Comments
Date: 02/22/11Rank: 4Comment:

Request Information From Our Sponsors
- VectorVest, Inc.
- Executive Premier Workshop
- One-Day Options Course
- OptionsPro
- Retirement Income Workshop
- Sure-Fire Trading Systems (VectorVest, Inc.)
- Trading as a Business Workshop
- VectorVest 7 EOD
- VectorVest 7 RealTime/IntraDay
- VectorVest AutoTester
- VectorVest Educational Services
- VectorVest OnLine
- VectorVest Options Analyzer
- VectorVest ProGraphics v6.0
- VectorVest ProTrader 7
- VectorVest RealTime Derby Tool
- VectorVest Simulator
- VectorVest Variator
- VectorVest Watchdog
- StockCharts.com, Inc.
- Candle Patterns
- Candlestick Charting Explained
- Intermarket Technical Analysis
- John Murphy on Chart Analysis
- John Murphy's Chart Pattern Recognition
- John Murphy's Market Message
- MurphyExplainsMarketAnalysis-Intermarket Analysis
- MurphyExplainsMarketAnalysis-Visual Analysis
- StockCharts.com
- Technical Analysis of the Financial Markets
- The Visual Investor
