

HOT TOPICS LIST
- MACD
- Fibonacci
- RSI
- Gann
- ADXR
- Stochastics
- Volume
- Triangles
- Futures
- Cycles
- Volatility
- ZIGZAG
- MESA
- Retracement
- Aroon
INDICATORS LIST
LIST OF TOPICS
PRINT THIS ARTICLE
by Chaitali Mohile
The potentially bullish breakouts of Anandigics have failed to surge.
Position: N/A
Chaitali Mohile
Active trader in the Indian stock markets since 2003 and a full-time writer. Trading is largely based upon technical analysis.
PRINT THIS ARTICLE
CHART ANALYSIS
ANAD Under Bearish Pressure
02/18/11 10:07:44 AMby Chaitali Mohile
The potentially bullish breakouts of Anandigics have failed to surge.
Position: N/A
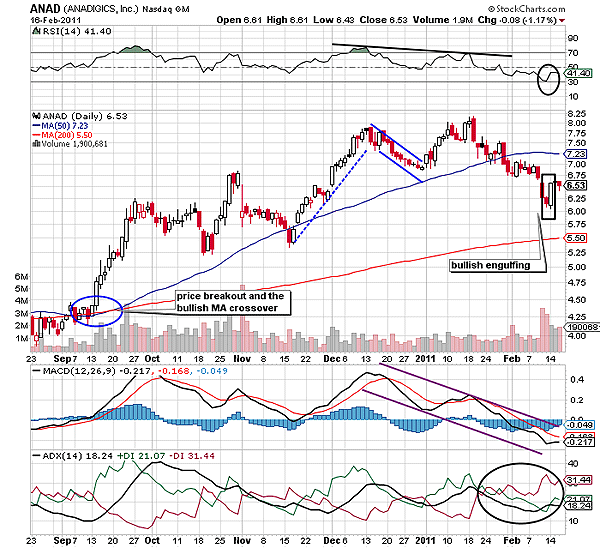
| A bullish moving average (MA) crossover and a price breakout generated robust positive sentiments for Anandigics (ANAD). The bullish moving average crossover occurred when the short-term MA breached the long-term MA and moved ahead. Here in Figure 1, the 50-day is the short-term and the 200-day is the long-term MA. In Figure 1, ANAD violated the two MA resistances and shifted in the bullish region of the price chart. Initially, the stock had an attractive upward movement, gaining a profit of $2 from the breakout point. As a penny stock, ANAD had to weather the volatility storm after every price jump. |
| The stock underwent a long jerky consolidation phase in October-November 2009 in which the 50-day MA support was challenged. Later, ANAD surged from $5.50 to $8 and again consolidated, retracing toward the 50-day MA support. This consolidation formed a bullish flag & pennant formation. The bullish continuation in Figure 1 broke upward but failed to reach the potential target of 8 - 5.50 = 2.50 + 7 = 9.50. The relative strength index (RSI) (14) formed lower highs, highlighting a negative divergence for the breakout rally. As a result, ANAD plunged below the 50-day MA support from the peak at $8. |
|
| FIGURE 1: ANAD, DAILY |
| Graphic provided by: StockCharts.com. |
| |
| The volume has been very discouraging throughout the rally. The moving average convergence/divergence(MACD) (12,26,9) has slipped down in negative territory, while the descending RSI (14) dropped below the 50 levels and is likely to establish support at 30 levels. In addition, the average directional index (ADX) (14) shows a weak trend below 20 levels. However, the buying and selling pressure are struggling to grab the trend in their favor. Although a bullish engulfing candlestick pattern has appeared in Figure 1, initiating a pullback rally would be little difficult for ANAD. The stock has always faced huge volatility; therefore, additional bearish pressure would not be a surprising element for ANAD. |
|
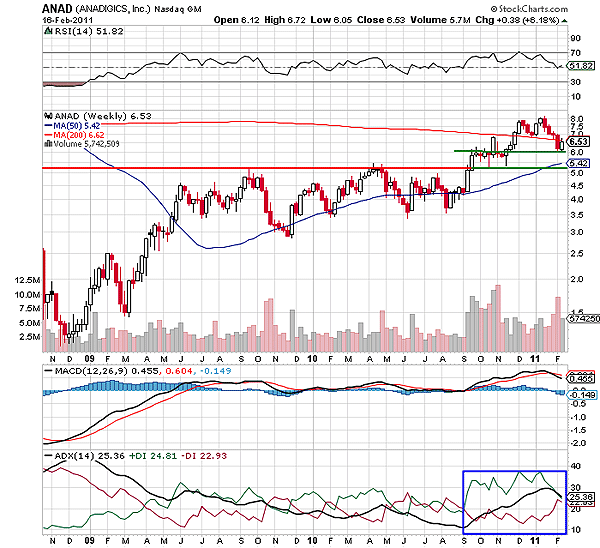
| FIGURE 2: ANAD, WEEKLY |
| Graphic provided by: StockCharts.com. |
| |
| On the weekly time frame in Figure 2, ANAD has formed a short-term double-top formation above the 200-day moving average (MA) support. Currently, the stock has rested at an intermediate support at $6. However, a bearish breakout of the bearish trend reversal formation would pull down ANAD by a few more points. The support-resistance line drawn in Figure 2 shows immediate support for the potential downward rally. The uptrend in ADX (14) is likely to reverse, which would strengthen the bearish force in the declining price rally. The RSI (14) and the MACD (12,26,9) are in a bullish zone, and the ADX (14) would require a few more sessions to confirm the downtrend. We can see that the buying pressure is still higher than the selling pressure, and therefore, the current trend is tricky to judge. |
| On the price chart in Figure 2, ANAD has support that would protect the fall. The 200-day MA resistance would keep the stock in a tight range and induce high uncertainty in the directional breakout. Considering both charts, it would be advisable for long traders to stay away till the stock stabilizes. |
Active trader in the Indian stock markets since 2003 and a full-time writer. Trading is largely based upon technical analysis.
| Company: | Independent |
| Address: | C1/3 Parth Indraprasth Towers. Vastrapur |
| Ahmedabad, Guj 380015 | |
| E-mail address: | chaitalimohile@yahoo.co.in |
Traders' Resource Links | |
| Independent has not added any product or service information to TRADERS' RESOURCE. | |
Click here for more information about our publications!
PRINT THIS ARTICLE

Request Information From Our Sponsors
- StockCharts.com, Inc.
- Candle Patterns
- Candlestick Charting Explained
- Intermarket Technical Analysis
- John Murphy on Chart Analysis
- John Murphy's Chart Pattern Recognition
- John Murphy's Market Message
- MurphyExplainsMarketAnalysis-Intermarket Analysis
- MurphyExplainsMarketAnalysis-Visual Analysis
- StockCharts.com
- Technical Analysis of the Financial Markets
- The Visual Investor
- VectorVest, Inc.
- Executive Premier Workshop
- One-Day Options Course
- OptionsPro
- Retirement Income Workshop
- Sure-Fire Trading Systems (VectorVest, Inc.)
- Trading as a Business Workshop
- VectorVest 7 EOD
- VectorVest 7 RealTime/IntraDay
- VectorVest AutoTester
- VectorVest Educational Services
- VectorVest OnLine
- VectorVest Options Analyzer
- VectorVest ProGraphics v6.0
- VectorVest ProTrader 7
- VectorVest RealTime Derby Tool
- VectorVest Simulator
- VectorVest Variator
- VectorVest Watchdog