HOT TOPICS LIST
- MACD
- Fibonacci
- RSI
- Gann
- ADXR
- Stochastics
- Volume
- Triangles
- Futures
- Cycles
- Volatility
- ZIGZAG
- MESA
- Retracement
- Aroon
INDICATORS LIST
LIST OF TOPICS
PRINT THIS ARTICLE
by Mike Carr, CMT
Exchange margin requirements for cotton increased by a third, to $7,000 a contract. Raising margins is usually done to cool speculation.
Position: N/A
Mike Carr, CMT
Mike Carr, CMT, is a member of the Market Technicians Association, and editor of the MTA's newsletter, Technically Speaking. He is also the author of "Smarter Investing in Any Economy: The Definitive Guide to Relative Strength Investing," and "Conquering the Divide: How to Use Economic Indicators to Catch Stock Market Trends."
PRINT THIS ARTICLE
BOLLINGER BANDS
Speculators Notice Cotton
02/17/11 10:07:01 AMby Mike Carr, CMT
Exchange margin requirements for cotton increased by a third, to $7,000 a contract. Raising margins is usually done to cool speculation.
Position: N/A
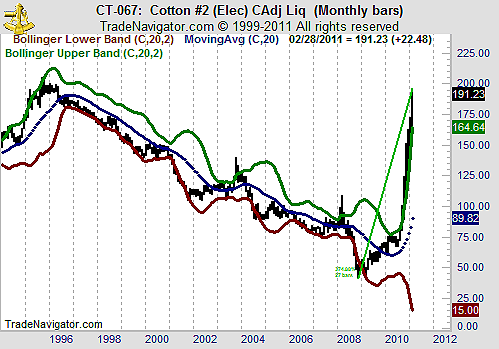
| Gold and grain markets tend to be in the news; many of them have been in bull markets for at least the past year. Less noticed by many has been cotton, which more than doubled in 2010 and is up about 375% since its November 2008 lows (Figure 1). |

|
| FIGURE 1: COTTON, MONTHLY. Cotton has been in a strong bull market for more than two years. |
| Graphic provided by: Trade Navigator. |
| |
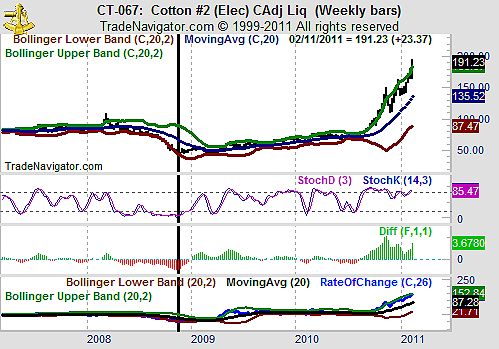
| Figure 2 shows a weekly chart of a continuous cotton contract. Stochastics was oversold, but had been for some time. The moving average convergence/divergence (MACD) had reached a bearish extreme, knowing when an indicator has reached an extreme can only be seen with certainty in hindsight. Bollinger bands offer a timely perspective on prices. |

|
| FIGURE 2: COTTON, WEEKLY. The black vertical line highlights the beginning of this bull market move. |
| Graphic provided by: Trade Navigator. |
| |
| Price had declined below the lower Bollinger band and was just moving back within the bands as the bull market began. Interestingly, the rate of change indicator exhibited the same behavior. The indicator had been walking along the lower band for much of 2008 and began moving higher, relative to the bands as prices started moving higher. |
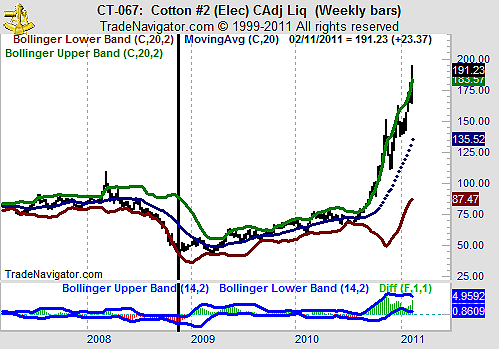
| Traditional indicators, such as stochastics and the MACD, offer their best signals only in hindsight. An oversold market can and often does become increasingly oversold and false indicator signals are quite common. The use of Bollinger bands can help frame an indicator and may offer valuable information when combined with price. As Figure 3 shows, bands can be added to any indicator. |

|
| FIGURE 3: COTTON, WEEKLY. Bollinger bands have been added to a MACD histogram, a technique that may help traders spot when the MACD has reached extreme levels. |
| Graphic provided by: Trade Navigator. |
| |
Mike Carr, CMT, is a member of the Market Technicians Association, and editor of the MTA's newsletter, Technically Speaking. He is also the author of "Smarter Investing in Any Economy: The Definitive Guide to Relative Strength Investing," and "Conquering the Divide: How to Use Economic Indicators to Catch Stock Market Trends."
| Website: | www.moneynews.com/blogs/MichaelCarr/id-73 |
| E-mail address: | marketstrategist@gmail.com |
Click here for more information about our publications!
Comments
Date: 02/22/11Rank: 4Comment:

Request Information From Our Sponsors
- VectorVest, Inc.
- Executive Premier Workshop
- One-Day Options Course
- OptionsPro
- Retirement Income Workshop
- Sure-Fire Trading Systems (VectorVest, Inc.)
- Trading as a Business Workshop
- VectorVest 7 EOD
- VectorVest 7 RealTime/IntraDay
- VectorVest AutoTester
- VectorVest Educational Services
- VectorVest OnLine
- VectorVest Options Analyzer
- VectorVest ProGraphics v6.0
- VectorVest ProTrader 7
- VectorVest RealTime Derby Tool
- VectorVest Simulator
- VectorVest Variator
- VectorVest Watchdog
- StockCharts.com, Inc.
- Candle Patterns
- Candlestick Charting Explained
- Intermarket Technical Analysis
- John Murphy on Chart Analysis
- John Murphy's Chart Pattern Recognition
- John Murphy's Market Message
- MurphyExplainsMarketAnalysis-Intermarket Analysis
- MurphyExplainsMarketAnalysis-Visual Analysis
- StockCharts.com
- Technical Analysis of the Financial Markets
- The Visual Investor
