HOT TOPICS LIST
- MACD
- Fibonacci
- RSI
- Gann
- ADXR
- Stochastics
- Volume
- Triangles
- Futures
- Cycles
- Volatility
- ZIGZAG
- MESA
- Retracement
- Aroon
INDICATORS LIST
LIST OF TOPICS
PRINT THIS ARTICLE
by Koos van der Merwe
The Horizon BetaPro exchange traded funds are used by traders in Canada to trade the indexes because they are geared.
Position: N/A
Koos van der Merwe
Has been a technical analyst since 1969, and has worked as a futures and options trader with First Financial Futures in Johannesburg, South Africa.
PRINT THIS ARTICLE
TECHNICAL ANALYSIS
Checking Out Horizon BetaPro ETFs
02/17/11 11:41:57 AMby Koos van der Merwe
The Horizon BetaPro exchange traded funds are used by traders in Canada to trade the indexes because they are geared.
Position: N/A
| The Horizons BetaPro (HBP) exchange traded funds (ETFs) consist of the Horizons BetaPro Bull Plus and Bear Plus ETFs (HBP Plus ETFs), Spread ETFs (HBP Spread ETFs), inverse ETFs (HBP Inverse ETFs) and single ETFs (HBP Single ETFs). The HBP Plus ETFs use leveraged investment techniques that magnify gains and losses and result in greater volatility in value. The Spread ETFs, which combine long and short exposure, also use leveraged investment techniques that magnify gains and losses and may result in greater volatility in value. HBP Plus ETFs and HBP Spread ETFs are subject to leverage risk, and all of the HBP ETFs are subject to aggressive investment risk and price volatility risk, which are described in the HBP ETF prospectus. Each HBP Plus ETF seeks a return, before fees and expenses, that is either 200% or -200% of the performance of a specified underlying index, commodity, or benchmark (the target) for a single day. Each HBP Spread ETF seeks a return, before fees and expenses, that is the sum of 100% of the performance of one target plus -100% of the performance of a second target for a single day. Each HBP Single ETF or HBP Inverse ETF seeks a return that is 100% or - 100%, respectively, of the performance of a target. Complicated? You bet, and that is why I believe that only professional traders use them in trading. One would think that a bull ETF and a bear ETF would move in equal percentages opposite to each other. Unfortunately that is not the case. The ETF is not influenced by supply and demand, but moves with the movement of the index it tracks. |

|
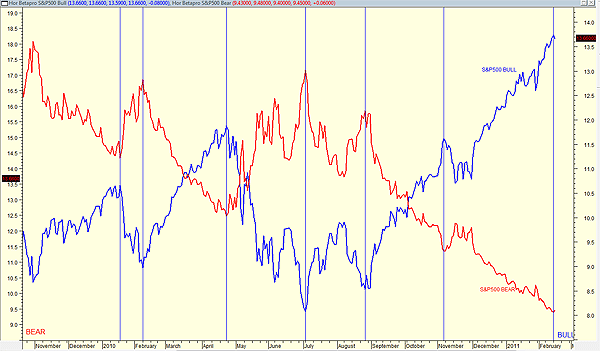
| FIGURE 1: COMPARISON OF HSU-T and HSD-T |
| Graphic provided by: AdvancedGET. |
| |
| Figure 1 shows the movement of both Standard & Poor's 500 ETFs. The bull ETF is in blue and the bear ETF in red. The price scale of the bull ETF is on the right side of the chart, and the price scale of the bear ETF is on the left side of the chart. The vertical lines highlight major turning points in both ETFs. Note how they both move inversely to each other. However, when you compare price moves, although the percentage move may be similar, the dollar move is very different. At the time of this writing, the HSU-T has fallen 0.66% or $0.09 per share, while the HSD-T has risen 0.53% or $0.05 per share, almost half the dollar value of the bull ETF. Because both graphs change direction at the same time as shown by the vertical lines, I have chosen the bull ETF to see whether its movement precedes or follows the S&P 500. A look at the chart shows that it moves exactly in line with the index. This means that there is no supply and demand principle in force. The ETF is simply an index. If you feel the index is rising, then you buy the bull ETF (HSU-T), and if it falls, you buy the bear ETF (HDU-T). One should not, however, forget that the ETF is geared. Look at the two horizontal lines. The index moves from 1135 to 1347, an increase of 18.68%. With the ETF moving the same distance, it moves from 10 to 14 = 4, 40%. The bear ETF over the same period would fall from 49 to 31 = 18, 37% but the dollar value is $0.04 to $0.18, quite a difference. There are a large number of Horizon Betapro ETFs that can be followed. Their website is www.hbpetfs.com. Check them out. They can save you from company disorder. |
Has been a technical analyst since 1969, and has worked as a futures and options trader with First Financial Futures in Johannesburg, South Africa.
| Address: | 3256 West 24th Ave |
| Vancouver, BC | |
| Phone # for sales: | 6042634214 |
| E-mail address: | petroosp@gmail.com |
Click here for more information about our publications!
Comments

|

Request Information From Our Sponsors
- StockCharts.com, Inc.
- Candle Patterns
- Candlestick Charting Explained
- Intermarket Technical Analysis
- John Murphy on Chart Analysis
- John Murphy's Chart Pattern Recognition
- John Murphy's Market Message
- MurphyExplainsMarketAnalysis-Intermarket Analysis
- MurphyExplainsMarketAnalysis-Visual Analysis
- StockCharts.com
- Technical Analysis of the Financial Markets
- The Visual Investor
- VectorVest, Inc.
- Executive Premier Workshop
- One-Day Options Course
- OptionsPro
- Retirement Income Workshop
- Sure-Fire Trading Systems (VectorVest, Inc.)
- Trading as a Business Workshop
- VectorVest 7 EOD
- VectorVest 7 RealTime/IntraDay
- VectorVest AutoTester
- VectorVest Educational Services
- VectorVest OnLine
- VectorVest Options Analyzer
- VectorVest ProGraphics v6.0
- VectorVest ProTrader 7
- VectorVest RealTime Derby Tool
- VectorVest Simulator
- VectorVest Variator
- VectorVest Watchdog
