HOT TOPICS LIST
- MACD
- Fibonacci
- RSI
- Gann
- ADXR
- Stochastics
- Volume
- Triangles
- Futures
- Cycles
- Volatility
- ZIGZAG
- MESA
- Retracement
- Aroon
INDICATORS LIST
LIST OF TOPICS
PRINT THIS ARTICLE
by Chaitali Mohile
The vertical bullish rally of Cabela's Inc has hit the 52-week high. Should traders hold their long positions or book profit?
Position: N/A
Chaitali Mohile
Active trader in the Indian stock markets since 2003 and a full-time writer. Trading is largely based upon technical analysis.
PRINT THIS ARTICLE
TECHNICAL ANALYSIS
Cabela's Heading Higher?
02/16/11 01:48:33 PMby Chaitali Mohile
The vertical bullish rally of Cabela's Inc has hit the 52-week high. Should traders hold their long positions or book profit?
Position: N/A
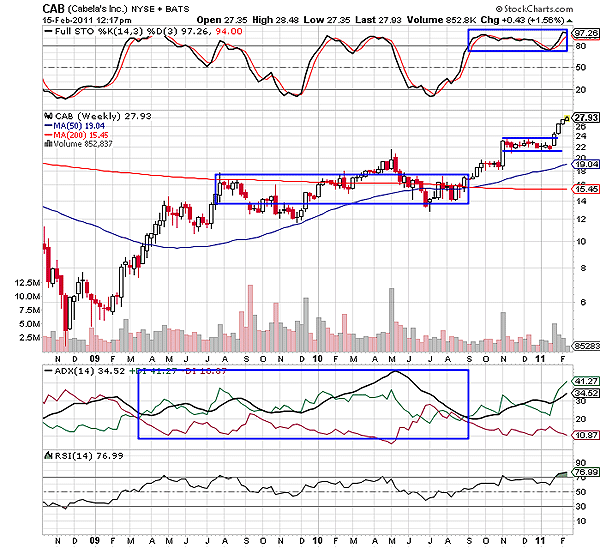
| Cabela's Inc. (CAB) has been in a robust uptrend for more than a year and half. In the bullish trend, the stock's price rally has witnessed positive strength and breached the resistance in its path. During such rallies, the bearish force hardly exists. In Figure 1, the average directional index (ADX) (14) has been above 30 levels with a huge buying pressure reflected by the positive directional index (+DI), signifying uptrend from 2009 onwards. But the price rally failed to move with the similar flow of the uptrend. The stock was jittery near the 200-day moving average (MA) resistance in Figure 1. Although the ADX (14) surged from the developing region (20 levels) to the well-developed area (above 30 levels), the price action remained highly volatile near the MA resistance (see the blue box). |

|
| FIGURE 1: CAB, WEEKLY |
| Graphic provided by: StockCharts.com. |
| |
| At one point, it looked like the 200-day MA resistance would become a support level, but failed due to existing bearish force. The marginally overheated ADX (14) plunged to 20 levels, indicating the weakness. However, the stock breached the MA resistance as soon as the fresh uptrend was born. Gradually, the fresh breakout rally gained strength. In Figure 1 we can see a long bullish candle that violated the previous high resistance. The candle showed large bullish strength, and later consolidated. The uptrend developed stronger. The full stochastic (14,3,3) is highly overbought and the relative strength index (RSI) shows healthy bullish strength in a new bullish breakout of the small consolidation phase. Recently, CAB has hit the 52-week high. On the weekly time frame in Figure 1, the shrinking size of the latest white candles show diminishing bullish strength in the rally. |

|
| FIGURE 2: CAB, DAILY |
| Graphic provided by: StockCharts.com. |
| |
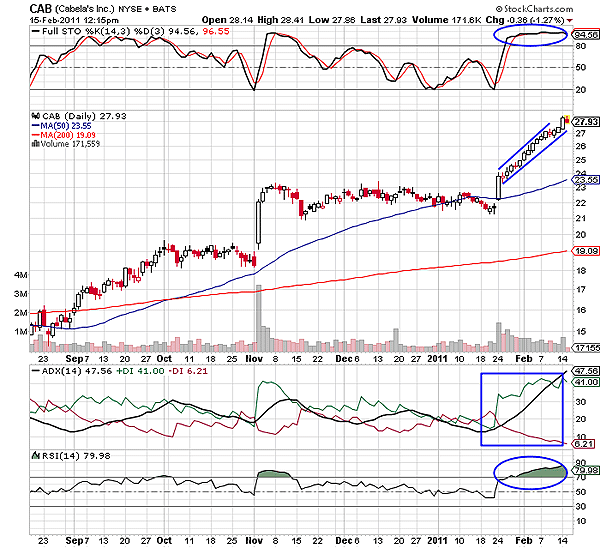
| CAB has rallied steeply upward in Figure 2. The price movement was pretty strong; however, the indicators are highly bullish, indicating a trend reversal possibility. The ADX (14) is extremely overheated, and the stochastic oscillator and RSI (14) are highly overbought. Therefore, the current rally is likely to reverse or consolidate at these higher levels. Thus, the traders can marginally book profits and reconsider their long positions after a confirmed bullish breakout. On the long-term chart (monthly time frame), CAB has a candlestick resistance at 30 levels that is likely to suppress the ongoing rally. Considering these technical aspects, traders can review their positions. |
Active trader in the Indian stock markets since 2003 and a full-time writer. Trading is largely based upon technical analysis.
| Company: | Independent |
| Address: | C1/3 Parth Indraprasth Towers. Vastrapur |
| Ahmedabad, Guj 380015 | |
| E-mail address: | chaitalimohile@yahoo.co.in |
Traders' Resource Links | |
| Independent has not added any product or service information to TRADERS' RESOURCE. | |
Click here for more information about our publications!
PRINT THIS ARTICLE

Request Information From Our Sponsors
- StockCharts.com, Inc.
- Candle Patterns
- Candlestick Charting Explained
- Intermarket Technical Analysis
- John Murphy on Chart Analysis
- John Murphy's Chart Pattern Recognition
- John Murphy's Market Message
- MurphyExplainsMarketAnalysis-Intermarket Analysis
- MurphyExplainsMarketAnalysis-Visual Analysis
- StockCharts.com
- Technical Analysis of the Financial Markets
- The Visual Investor
- VectorVest, Inc.
- Executive Premier Workshop
- One-Day Options Course
- OptionsPro
- Retirement Income Workshop
- Sure-Fire Trading Systems (VectorVest, Inc.)
- Trading as a Business Workshop
- VectorVest 7 EOD
- VectorVest 7 RealTime/IntraDay
- VectorVest AutoTester
- VectorVest Educational Services
- VectorVest OnLine
- VectorVest Options Analyzer
- VectorVest ProGraphics v6.0
- VectorVest ProTrader 7
- VectorVest RealTime Derby Tool
- VectorVest Simulator
- VectorVest Variator
- VectorVest Watchdog
