HOT TOPICS LIST
- MACD
- Fibonacci
- RSI
- Gann
- ADXR
- Stochastics
- Volume
- Triangles
- Futures
- Cycles
- Volatility
- ZIGZAG
- MESA
- Retracement
- Aroon
INDICATORS LIST
LIST OF TOPICS
PRINT THIS ARTICLE
by Billy Williams
In an industry where indicators flash buy and sell signals, there are only three real factors that make up successful trading.
Position: N/A
Billy Williams
Billy Williams has been trading the markets for 27 years, specializing in momentum trading with stocks and options.
PRINT THIS ARTICLE
TECHNICAL ANALYSIS
The Three Real Factors To Profitable Trading
02/15/11 08:29:30 AMby Billy Williams
In an industry where indicators flash buy and sell signals, there are only three real factors that make up successful trading.
Position: N/A
| In trading stocks or any kind of security, there are three directions that price can trade: up, down, or sideways. Only three directions, but many traders struggle because they rely far too heavily on indicators such as price oscillators to reveal to them when it's time to enter and exit. And, truthfully, it's not completely the traders' fault when indicators are advertised in every trading magazine about some new revolutionary indicator that has called every bottom or top since 1987 or on late-night TV where infomercials detail the success stories of regular people who use some red light/green light system for scoring big in forex. This lack of understanding how the market really works is fertile ground for the carnival barkers who specialize in selling things to aspiring traders but for the most part is pretty useless. Even if it is useful in the beginning, the markets are dynamic and therefore always changing, so the shelf life for that new set of indicators may be limited. |

|
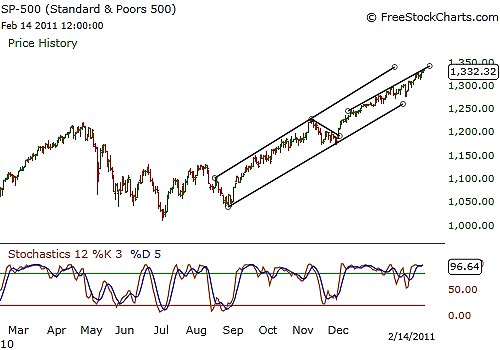
| FIGURE 1: S&P 500. If you had avoided trading because the S&P 500 was overbought on the stochastic, you would have missed a 140 point move from December 1, 2010 till now! |
| Graphic provided by: www.freestockcharts.com. |
| |
| There are fundamentally three factors you have to consider when trading the market, and they are price, volume, and time. Learning how to analyze price action is the cornerstone to all successful trading and if you are a true student of trading, then by reading about the great traders will help you understand that they had a deep appreciation for the art of reading price action. William O'Neil and Jesse Livermore, for example, are two legendary traders who learned early on that by studying price action, they could study what was happening real-time as the market was trading in the present and not to some knee-jerk response to some mechanical indicator. If you are relying on an oscillator such as the stochastics to judge the condition of the Standard & Poor's 500 right now, you would come to the conclusion that the S&P would be overbought, hesitant to make any type of long entry. However, the S&P 500 has been showing an overbought condition since December 1, 2010, and has since risen almost 140 points! (See Figure 1.) |

|
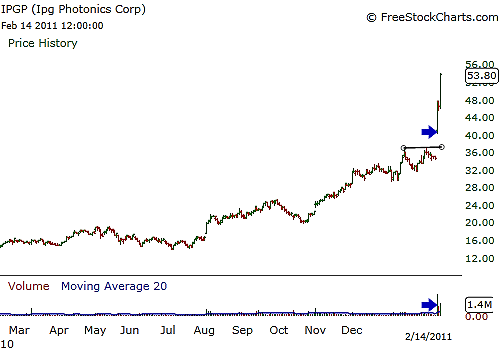
| FIGURE 2: IPGP. Price, volume, and time are all revealed as IPGP exploded higher out of price base on higher volume, revealing the time to enter the move. IPGP went on to gain almost 20 points in three days! |
| Graphic provided by: www.freestockcharts.com. |
| |
| Instead, by studying price itself you can clearly see that the S&P is in a solid uptrend and would trade accordingly while using stops to protect you from risk. Volume is to price what rocket fuel is to the space shuttle -- it is the sustaining energy that feeds price's movement. There are two types of volume -- buying or selling -- also called accumulation or distribution, respectively. |
| When one side, buyers or sellers, have control of a stock, it will be revealed in the stock's volume, helping you determine whether a stock is likely to rise or fall as a result. Volume also helps you with the third factor, time. |
| Explosive price action is typically followed by large increases in volume that help you determine when to time your entry. An explosive move out of a consolidated pattern on large volume reveals the time with which you have to enter a position as the stock takes off. These three factors work together in helping you trade successfully, but if you are looking at oscillators and lagging indicators, then you are missing the real essential factors that form the foundation for profitable speculation. Indicators have their place as secondary visual references or as confirmation of what price, volume, and time is telling you in the present, which is the only thing that really matters to top traders. See Figure 2. |
Billy Williams has been trading the markets for 27 years, specializing in momentum trading with stocks and options.
| Company: | StockOptionSystem.com |
| E-mail address: | stockoptionsystem.com@gmail.com |
Traders' Resource Links | |
| StockOptionSystem.com has not added any product or service information to TRADERS' RESOURCE. | |
Click here for more information about our publications!
Comments
Date: 02/22/11Rank: 5Comment:

Request Information From Our Sponsors
- StockCharts.com, Inc.
- Candle Patterns
- Candlestick Charting Explained
- Intermarket Technical Analysis
- John Murphy on Chart Analysis
- John Murphy's Chart Pattern Recognition
- John Murphy's Market Message
- MurphyExplainsMarketAnalysis-Intermarket Analysis
- MurphyExplainsMarketAnalysis-Visual Analysis
- StockCharts.com
- Technical Analysis of the Financial Markets
- The Visual Investor
- VectorVest, Inc.
- Executive Premier Workshop
- One-Day Options Course
- OptionsPro
- Retirement Income Workshop
- Sure-Fire Trading Systems (VectorVest, Inc.)
- Trading as a Business Workshop
- VectorVest 7 EOD
- VectorVest 7 RealTime/IntraDay
- VectorVest AutoTester
- VectorVest Educational Services
- VectorVest OnLine
- VectorVest Options Analyzer
- VectorVest ProGraphics v6.0
- VectorVest ProTrader 7
- VectorVest RealTime Derby Tool
- VectorVest Simulator
- VectorVest Variator
- VectorVest Watchdog
