HOT TOPICS LIST
- MACD
- Fibonacci
- RSI
- Gann
- ADXR
- Stochastics
- Volume
- Triangles
- Futures
- Cycles
- Volatility
- ZIGZAG
- MESA
- Retracement
- Aroon
INDICATORS LIST
LIST OF TOPICS
PRINT THIS ARTICLE
by Billy Williams
Like an ocean wave, price ebbs and flows in a pattern that reveals the trend if you know where to look.
Position: Hold
Billy Williams
Billy Williams has been trading the markets for 27 years, specializing in momentum trading with stocks and options.
PRINT THIS ARTICLE
TECHNICAL ANALYSIS
How To Identify Higher Highs And Higher Lows
02/15/11 12:11:40 PMby Billy Williams
Like an ocean wave, price ebbs and flows in a pattern that reveals the trend if you know where to look.
Position: Hold
| The adage "the trend is your friend" has echoed throughout Wall Street and trading rooms throughout the world for decades. A trend firmly in place is likely to continue, as stated in Newton's First Law of Physics, which states, "Every object in a state of uniform motion tends to remain in that state of motion unless an external force is applied to it." In trading, a trend is likely to continue unless something fundamental changes to the dynamics of the price action from the outside such as bad earnings, massive distribution of the stock among sellers, threat of war, or corporate scandal. It is at that point the trend might fall into a trading range or reverse direction. Absence of that, a trend in place is likely to continue, which makes trend trading one of the most reliable methods of trading. |

|
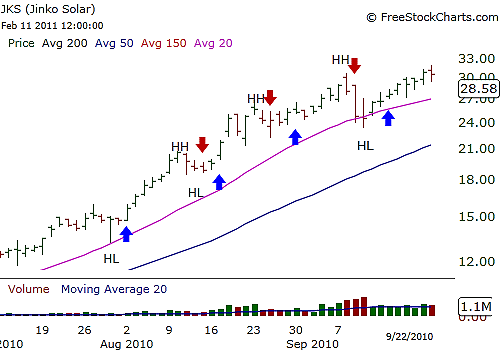
| FIGURE 1: JINKO SOLAR. JKS made a steady series of higher highs and higher lows over a two-month period, which revealed several low-risk entry points in an established trend if you know how to spot them. Note that each turning point was confirmed one or more days later. |
| Graphic provided by: www.freestockcharts.com. |
| |
| The problem is that despite how reliable a method trend trading is, most traders struggle with spotting the trend in the first place and, worse, how to take advantage of it (Figure 1). In bullish trends, where the trend trades upward, the stock will ebb in a steady successive series of higher highs and higher lows in the price action. It is this steady back-and-forth trading while steadily going higher, forming these highs and lows, reveals both the bullish trend and low-risk entry points in the stock's price action that is fundamental to a trend trading. To spot a higher high, first identify a significant high made in the price action and then wait for a price bar to close below the intraday high of the price bar that has made the price high. Once this occurs, mark that price bar with the original significant price high and mark it as "HH" for a higher high. |
| Then, observe the price action and spot when it makes a significant price low. Identify that price low and wait for the next price bar to close above the price bar that has made the significant price low. Once that occurs, mark the price with the original significant price low as "HL" for higher low. This successive series of higher highs and higher lows reveal a bullish trend in place, preparing you for trading to the upside. Using a simple set of moving averages like the 20-day and 50-day simple moving averages (SMAs) can help give you a visual representation of the price action itself, which also helps you judge the pullback in the stock's price action. This can help you time your entries when price action confirms a turn back to the upside. |
| Over a two-month period, Jinko Solar (JKS) made a steady series of higher highs and higher lows, revealing that the stock was both under accumulation as well as trending solidly to the upside. During that period, there were several pullbacks in price that were confirmed turning points back to the upside, offering low-risk entry points. This was also confirmed by the 20-day and 50-day SMAs, which were pointing upward in the direction of an uptrend. Having the tools to spot these turning points in a stock's price action can help you stay on the right side of the trend, time your entries better, and result in more winning trades and a lot more money over time. |
Billy Williams has been trading the markets for 27 years, specializing in momentum trading with stocks and options.
| Company: | StockOptionSystem.com |
| E-mail address: | stockoptionsystem.com@gmail.com |
Traders' Resource Links | |
| StockOptionSystem.com has not added any product or service information to TRADERS' RESOURCE. | |
Click here for more information about our publications!
Comments
Date: 02/22/11Rank: 4Comment:

|

Request Information From Our Sponsors
- StockCharts.com, Inc.
- Candle Patterns
- Candlestick Charting Explained
- Intermarket Technical Analysis
- John Murphy on Chart Analysis
- John Murphy's Chart Pattern Recognition
- John Murphy's Market Message
- MurphyExplainsMarketAnalysis-Intermarket Analysis
- MurphyExplainsMarketAnalysis-Visual Analysis
- StockCharts.com
- Technical Analysis of the Financial Markets
- The Visual Investor
- VectorVest, Inc.
- Executive Premier Workshop
- One-Day Options Course
- OptionsPro
- Retirement Income Workshop
- Sure-Fire Trading Systems (VectorVest, Inc.)
- Trading as a Business Workshop
- VectorVest 7 EOD
- VectorVest 7 RealTime/IntraDay
- VectorVest AutoTester
- VectorVest Educational Services
- VectorVest OnLine
- VectorVest Options Analyzer
- VectorVest ProGraphics v6.0
- VectorVest ProTrader 7
- VectorVest RealTime Derby Tool
- VectorVest Simulator
- VectorVest Variator
- VectorVest Watchdog
