HOT TOPICS LIST
- MACD
- Fibonacci
- RSI
- Gann
- ADXR
- Stochastics
- Volume
- Triangles
- Futures
- Cycles
- Volatility
- ZIGZAG
- MESA
- Retracement
- Aroon
INDICATORS LIST
LIST OF TOPICS
PRINT THIS ARTICLE
by Koos van der Merwe
Using a trailing stop as a buy signal can prove highly profitable.
Position: Buy
Koos van der Merwe
Has been a technical analyst since 1969, and has worked as a futures and options trader with First Financial Futures in Johannesburg, South Africa.
PRINT THIS ARTICLE
TRADING SYSTEMS
Using A Trailing Stop As A Buy-Sell Signal
02/14/11 11:00:10 AMby Koos van der Merwe
Using a trailing stop as a buy signal can prove highly profitable.
Position: Buy
| Entercom is one of the five largest radio broadcasting companies in the US, with a nationwide portfolio in excess of 100 stations in 23 markets. Entercom focuses on creating effective integrated marketing solutions for its customers that incorporate the company's audio, digital, and experiential assets. Here's an example of a trailing stop as a buy signal can prove quite profitable. |

|
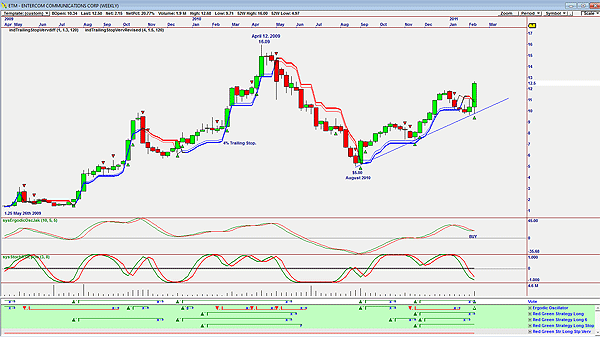
| FIGURE 1: ETM, WEEKLY |
| Graphic provided by: Omnitrader. |
| |
| Figure 1, a weekly chart, shows how the price moved from a low of $1.25 on May 26, 2009, to a high of $16.09 by April 12, 2009. The price then dropped to $5.00 by August 2010 after giving a sell-stop signal when it broke below the 4% trailing stop. The vote line gave a buy signal in August 2010 at $5.00. The price then moved up steadily to its present level of $12.50, with another buy signal being given by the vote line. The vote line is the summary of the various strategies used as shown on the chart. These are strategies determined by the OmniTrader program. Note the two indicators on the chart, the ergodic oscillators, which has given a buy signal, and the stochastic RSI cycle oscillator, which is close to giving a buy signal. To confirm the weekly buy signal, we should look at the daily chart. |

|
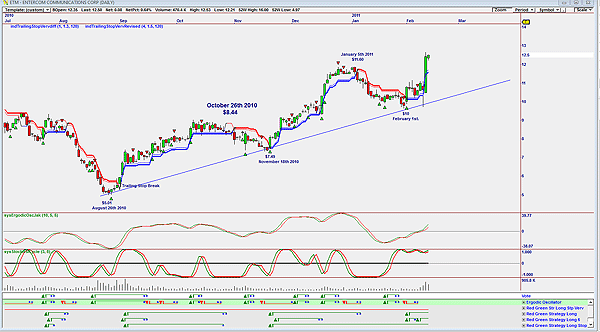
| FIGURE 2: ETM, DAILY |
| Graphic provided by: OmniTrader. |
| |
| The vote line of the daily chart (Figure 2) shows a buy signal was given when the price was $6.40 on August 18. The price was below the 4% trailing stop and very soon dropped to $5.01, suggesting the buy signal given was not very accurate. Note how the price gave a far better buy signal by breaking above the trailing stop and only gave a sell signal on October 26 at $8.44. On November 18, 2010, the share at $7.49 gave a buy signal by breaking above the trailing stop and rose to a high of $11.60, giving a sell signal on January 5, 2011. On February 1 at $10, the share price gave a new buy signal by breaking above the trailing stop. Once again the vote line was early with its signal. Do note that the ergodic oscillator is still moving up, but the stochastic RSI indicator is at oversold levels. With the price at $12.50, buying the share as it broke above the trailing stop at $10 would be highly profitable. Using a trailing stop as a buy and sell signal can be highly profitable and should be added to our quiver of trading strategies. |
Has been a technical analyst since 1969, and has worked as a futures and options trader with First Financial Futures in Johannesburg, South Africa.
| Address: | 3256 West 24th Ave |
| Vancouver, BC | |
| Phone # for sales: | 6042634214 |
| E-mail address: | petroosp@gmail.com |
Click here for more information about our publications!
PRINT THIS ARTICLE

Request Information From Our Sponsors
- StockCharts.com, Inc.
- Candle Patterns
- Candlestick Charting Explained
- Intermarket Technical Analysis
- John Murphy on Chart Analysis
- John Murphy's Chart Pattern Recognition
- John Murphy's Market Message
- MurphyExplainsMarketAnalysis-Intermarket Analysis
- MurphyExplainsMarketAnalysis-Visual Analysis
- StockCharts.com
- Technical Analysis of the Financial Markets
- The Visual Investor
- VectorVest, Inc.
- Executive Premier Workshop
- One-Day Options Course
- OptionsPro
- Retirement Income Workshop
- Sure-Fire Trading Systems (VectorVest, Inc.)
- Trading as a Business Workshop
- VectorVest 7 EOD
- VectorVest 7 RealTime/IntraDay
- VectorVest AutoTester
- VectorVest Educational Services
- VectorVest OnLine
- VectorVest Options Analyzer
- VectorVest ProGraphics v6.0
- VectorVest ProTrader 7
- VectorVest RealTime Derby Tool
- VectorVest Simulator
- VectorVest Variator
- VectorVest Watchdog
