HOT TOPICS LIST
- MACD
- Fibonacci
- RSI
- Gann
- ADXR
- Stochastics
- Volume
- Triangles
- Futures
- Cycles
- Volatility
- ZIGZAG
- MESA
- Retracement
- Aroon
INDICATORS LIST
LIST OF TOPICS
PRINT THIS ARTICLE
by Koos van der Merwe
The doughnut company reported improved sales and profits but missed market expectations.
Position: Accumulate
Koos van der Merwe
Has been a technical analyst since 1969, and has worked as a futures and options trader with First Financial Futures in Johannesburg, South Africa.
PRINT THIS ARTICLE
CUP WITH HANDLE
Krispy Kreme And Its Targets
02/14/11 10:24:41 AMby Koos van der Merwe
The doughnut company reported improved sales and profits but missed market expectations.
Position: Accumulate
| Things look better, but not as good as they could have been. This is a statement heard over and over again when various companies report their quarterly results. As chartists, we don't look at fundamentals, although to be quite honest I do have a spreadsheet that analyzes fundamentals and gives me a rating for a stock. I use the spreadsheet when my charts suggest a stock is worth buying. However, when a chart pattern develops, no matter what the fundamentalists expect, we can be sure that our targets will be met. This chart of Krispy Kreme (KKD) is a perfect example. |

|
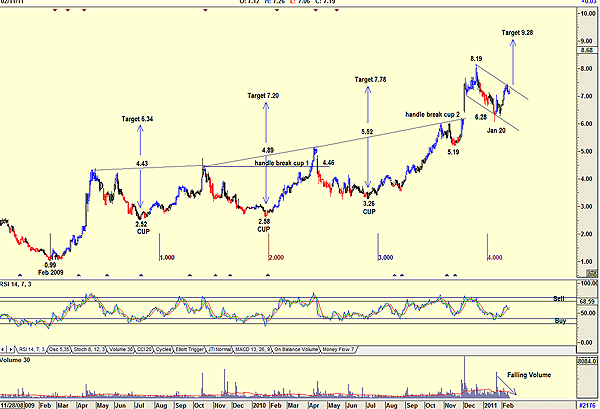
| FIGURE 1: KKD, DAILY |
| Graphic provided by: AdvancedGET. |
| |
| Figure 1 shows how three cup & handle patterns developed, all of which eventually rose to meet their targets. Cup 1: The target was $6.34 (4.43-2.52 = 1.91 + 4.43 = 6.34). So it did take some time before that target was reached, but we knew it was there. With a cup & handle pattern, we buy the stock when it breaks above the handle. In the instance of cup 1, a handle only developed with another cup & handle pattern, cup 2. Cup 2: The target here was $7.20 (4.89 - 2.58 = 2.31 + 4.89 = 7.20). We would probably have bought at $4.46 when the handle of cup 1 was broken, but the length of time to do this would have been a negative warning sign. Rather than penetrate the handle, the price fell to $3.26, forming cup 3. Cup 3: With cup 3, the target was $7.78 (5.52 - 3.26 = 2.26 + 5.52 = 7.78). Then, of course, you would have kicked yourself when the handle of cup 3 was penetrated at $6.28 and on a gap for not buying earlier. (Depends whether you enjoy eating their doughnuts.) The cup 2 target of $7.78 was broken, with the price rising to $8.19 before falling back to $6.28 to fill the gap. The share price has now formed a flag pattern, with a target of the upper trendline of $9.28. Would you buy it? The answer is yes, because the relative strength index (RSI) is bullish. However, falling volume as the price rose would be a negative, but do note that volume continued to fall as the price fell over the last two days, a positive sign. Would I buy Krispy Kreme? Looking at the cycle pattern shown on the chart, and allowing for an error, it does look as though the low of January 20 could be a low, so yes, I would be a buyer but with a long-term hold. |
Has been a technical analyst since 1969, and has worked as a futures and options trader with First Financial Futures in Johannesburg, South Africa.
| Address: | 3256 West 24th Ave |
| Vancouver, BC | |
| Phone # for sales: | 6042634214 |
| E-mail address: | petroosp@gmail.com |
Click here for more information about our publications!
PRINT THIS ARTICLE

Request Information From Our Sponsors
- StockCharts.com, Inc.
- Candle Patterns
- Candlestick Charting Explained
- Intermarket Technical Analysis
- John Murphy on Chart Analysis
- John Murphy's Chart Pattern Recognition
- John Murphy's Market Message
- MurphyExplainsMarketAnalysis-Intermarket Analysis
- MurphyExplainsMarketAnalysis-Visual Analysis
- StockCharts.com
- Technical Analysis of the Financial Markets
- The Visual Investor
- VectorVest, Inc.
- Executive Premier Workshop
- One-Day Options Course
- OptionsPro
- Retirement Income Workshop
- Sure-Fire Trading Systems (VectorVest, Inc.)
- Trading as a Business Workshop
- VectorVest 7 EOD
- VectorVest 7 RealTime/IntraDay
- VectorVest AutoTester
- VectorVest Educational Services
- VectorVest OnLine
- VectorVest Options Analyzer
- VectorVest ProGraphics v6.0
- VectorVest ProTrader 7
- VectorVest RealTime Derby Tool
- VectorVest Simulator
- VectorVest Variator
- VectorVest Watchdog
