HOT TOPICS LIST
- MACD
- Fibonacci
- RSI
- Gann
- ADXR
- Stochastics
- Volume
- Triangles
- Futures
- Cycles
- Volatility
- ZIGZAG
- MESA
- Retracement
- Aroon
INDICATORS LIST
LIST OF TOPICS
PRINT THIS ARTICLE
by Andrew Hetherington
Eastman Kodak has recently broken out of its 5-6 month accumulation pattern.
Position: N/A
Andrew Hetherington
Classic Dow Theorist who trades as a pure technician, using pattern recognition.
PRINT THIS ARTICLE
CHART ANALYSIS
Smile, It's Kodak Time
02/19/02 08:34:35 AMby Andrew Hetherington
Eastman Kodak has recently broken out of its 5-6 month accumulation pattern.
Position: N/A
| It's very hard to believe but now is the time for Eastman Kodak [EK] to move. Surprise, surprise! Who would actually believe you if you said this? I can hardly believe it myself but it's true. |
| Why is it so hard to believe? Perhaps because they have been behind the curve on so many fronts the past number of years. It's near the low of 1985 and hasn't split since 1987. Wow, what a dog it's been. |

|
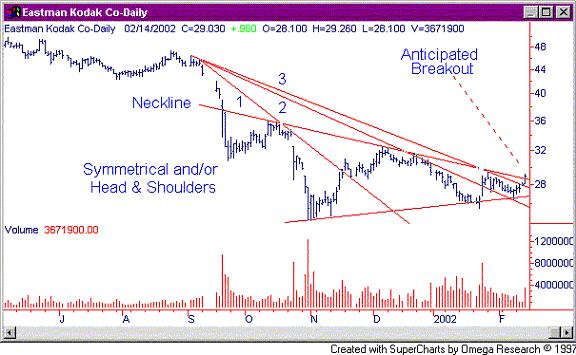
| Figure 1: Daily chart for EK. |
| Graphic provided by: SuperCharts. |
| |
| Now that it has bottomed out and is ready to go higher we can discuss the positives. The chart is very strong and breaking topside. It has dropped from $47.16 since August 27, 2001. It has formed a very nice 5-6 month reverse head and shoulders pattern with the bottom of the head at $24.40 on November 1, 2001. Some may think it is a symmetrical triangle as well. The point is to know which direction it is heading as opposed to what pattern has been created. Secondly, there are always patterns within patterns. Most head and shoulders patterns look like triangles if they are good examples. A case can be made for either pattern on this equity. The volume suits both perfectly. The volume is the key in determining the difference in the patterns. |
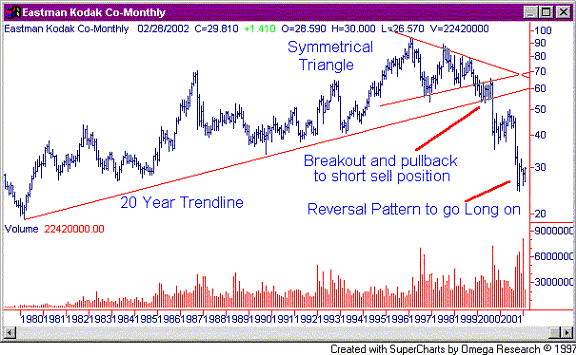
 Figure 2: Monthly chart for EK. In addition to the actual pattern on Kodak, the third fan line breaking with an increase in volume is very significant. This increase in activity is necessary to confirm the price breaking out to the upside. On the downside it's not a requirement. The normal reaction on these breaks is for the equity to move higher on higher volume and then slide back down along the fan line, which should be your entry point. These throwbacks on the longs are the proper entry point. Of course, some equities will continue to climb without a throwback but this is unusual. In this circumstance I never chase a stock beyond my predetermined buy point. A buy in point of $28.00 - $29.00 is reasonable over the medium to long term. Keep in mind that this is not a short-term play. |
| Who ever thought it would turn around? Apparently Kodak has gotten their act together enough to convince investors and speculators to accumulate positions. That's exactly what has happened here. This type of accumulation pattern demonstrates underlying strength. When you follow the money trail you will make very few errors when investing. |
Classic Dow Theorist who trades as a pure technician, using pattern recognition.
| Toronto, Canada |
Click here for more information about our publications!
Comments
Date: 02/26/02Rank: 5Comment: I very much like your discussions. I am planning to subscribe to your service. I do primarily technical trading and find your articles clear and useful.

Request Information From Our Sponsors
- StockCharts.com, Inc.
- Candle Patterns
- Candlestick Charting Explained
- Intermarket Technical Analysis
- John Murphy on Chart Analysis
- John Murphy's Chart Pattern Recognition
- John Murphy's Market Message
- MurphyExplainsMarketAnalysis-Intermarket Analysis
- MurphyExplainsMarketAnalysis-Visual Analysis
- StockCharts.com
- Technical Analysis of the Financial Markets
- The Visual Investor
- VectorVest, Inc.
- Executive Premier Workshop
- One-Day Options Course
- OptionsPro
- Retirement Income Workshop
- Sure-Fire Trading Systems (VectorVest, Inc.)
- Trading as a Business Workshop
- VectorVest 7 EOD
- VectorVest 7 RealTime/IntraDay
- VectorVest AutoTester
- VectorVest Educational Services
- VectorVest OnLine
- VectorVest Options Analyzer
- VectorVest ProGraphics v6.0
- VectorVest ProTrader 7
- VectorVest RealTime Derby Tool
- VectorVest Simulator
- VectorVest Variator
- VectorVest Watchdog
