HOT TOPICS LIST
- MACD
- Fibonacci
- RSI
- Gann
- ADXR
- Stochastics
- Volume
- Triangles
- Futures
- Cycles
- Volatility
- ZIGZAG
- MESA
- Retracement
- Aroon
INDICATORS LIST
LIST OF TOPICS
PRINT THIS ARTICLE
by Billy Williams
The market is still trending higher while certain indicators reveal which stocks are setting up for a runaway move.
Position: Buy
Billy Williams
Billy Williams has been trading the markets for 27 years, specializing in momentum trading with stocks and options.
PRINT THIS ARTICLE
TECHNICAL ANALYSIS
Key Stocks Setting Up For Explosive Moves
02/11/11 08:44:35 AMby Billy Williams
The market is still trending higher while certain indicators reveal which stocks are setting up for a runaway move.
Position: Buy
| Whatever anxiety investors may have about the economy throughout the world, it doesn't seem to be carrying over to the stock market. Since the beginning of 2011, the Standard & Poor's 500 has gained an incredible 60 points, while the Dow Jones Industrial Average (DJIA) has gained almost 700 points. Still, there are key stocks that have been tightening their trading ranges either in anticipation of a selloff or consolidating their gains before making another bull run. These low-volatility ranges are indicative of stocks that are undergoing a contraction in price action after experiencing a huge expansion in stock value. It is in these areas of price contraction where chart patterns form and low-risk entries make themselves available for the trader that has the wherewithal to spot and exploit these high-probability trade setups. |

|
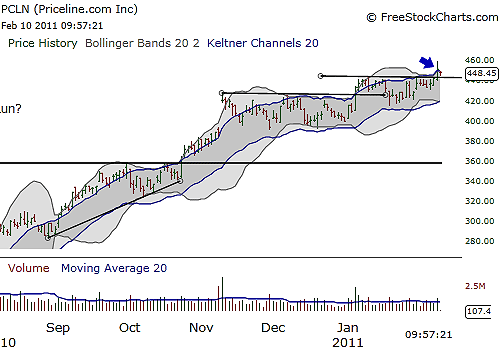
| FIGURE 1: PCLN. Priceline forms a base-on-base pattern while the Bollinger bands contract within the Keltner channels, revealing a possible explosive move to the upside setting up. |
| Graphic provided by: www.freestockcharts.com. |
| |
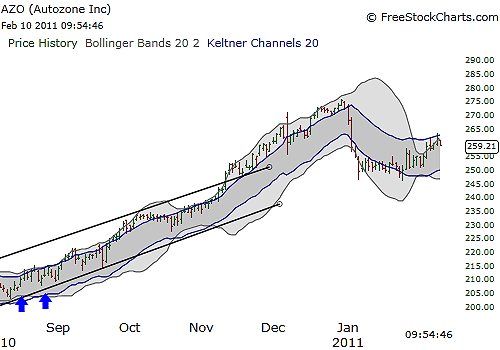
| Two tools that can be helpful in spotting these periods of price contraction are using a combination of indicators like the Keltner channels and Bollinger bands (Figures 1 and 2). Keltner channels for trading bands are based on a combination of average price, the close, and the opening of a stock's daily trading range and form three trading bands around the security as a visual reference to that range. Bollinger bands do the same, but instead, use price volatility to form its trading bands and give a visual reference to that daily trading volatility. |

|
| FIGURE 2: AZO. AutoZone experiences a pullback in price, then volatility contracts within the Keltner channels trading bands for a possible explosive resumption of the uptrend. |
| Graphic provided by: www.freestockcharts.com. |
| |
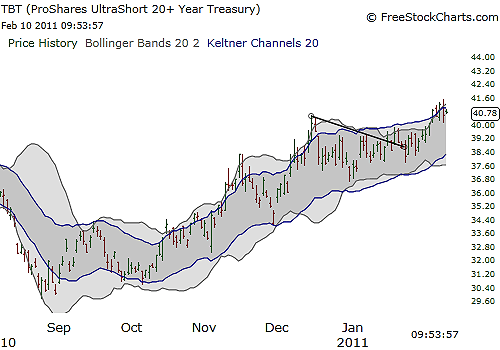
| These differing trading bands help you gauge where support and resistance exist in the stock's price range to help you determine entry and exit points as well as overbought and oversold conditions in the price action. However, by overlaying these two indicators on top of the price action on its chart, you spot contracted price ranges when the Bollinger bands trade within the trading bands of the Keltner channels themselves. This is critical to spotting low-risk entries because volatility has a tendency to revert to its mean, meaning that as volatility spikes higher, it will eventually revert to its average baseline. Likewise, and what makes this an important factor to you, is that as volatility falls below its average baseline, it will explode higher at some point and take the stock's price with it. This is easily identified when the Bollinger bands trade within the daily price averages of the Keltner channels, setting the stage for an explosive move out of this range. See Figure 3. |

|
| FIGURE 3: TBT. The exchange traded fund (TBT) forms a flag pattern while contracting within a tight trading range as indicated with the Bollinger bands and Keltner channels, breaking through the upper trendline and beginning what may be the start of a new uptrend. |
| Graphic provided by: www.freestockcharts.com. |
| |
| Fundamental to a successful trade is to keep in mind the dominant trend that is under way in the stock itself. The trade setup itself is less important than knowing what the trend is already in place and then letting the trade setup confirm that entry by moving in the direction of that trend. If the trade were to fall apart and move in the opposite direction, don't chase it. Instead, wait for the setup to reveal itself once again or, if there is a countertrend taking place, wait for another trade setup in the new direction. |
| Price action moves from expansion to contraction and then repeats this sequence over and over again. By keeping this in mind and spotting the trend that is in place, you will trade on the right side of the market and, like a skilled sniper, using a combination of technical analysis, Bollinger bands, Keltner channels, patience, and focused action when the time comes for it, you will increase the odds of your trading success as well as the percentage of winning trades over time. |
Billy Williams has been trading the markets for 27 years, specializing in momentum trading with stocks and options.
| Company: | StockOptionSystem.com |
| E-mail address: | stockoptionsystem.com@gmail.com |
Traders' Resource Links | |
| StockOptionSystem.com has not added any product or service information to TRADERS' RESOURCE. | |
Click here for more information about our publications!
Comments

Request Information From Our Sponsors
- StockCharts.com, Inc.
- Candle Patterns
- Candlestick Charting Explained
- Intermarket Technical Analysis
- John Murphy on Chart Analysis
- John Murphy's Chart Pattern Recognition
- John Murphy's Market Message
- MurphyExplainsMarketAnalysis-Intermarket Analysis
- MurphyExplainsMarketAnalysis-Visual Analysis
- StockCharts.com
- Technical Analysis of the Financial Markets
- The Visual Investor
- VectorVest, Inc.
- Executive Premier Workshop
- One-Day Options Course
- OptionsPro
- Retirement Income Workshop
- Sure-Fire Trading Systems (VectorVest, Inc.)
- Trading as a Business Workshop
- VectorVest 7 EOD
- VectorVest 7 RealTime/IntraDay
- VectorVest AutoTester
- VectorVest Educational Services
- VectorVest OnLine
- VectorVest Options Analyzer
- VectorVest ProGraphics v6.0
- VectorVest ProTrader 7
- VectorVest RealTime Derby Tool
- VectorVest Simulator
- VectorVest Variator
- VectorVest Watchdog
