HOT TOPICS LIST
- MACD
- Fibonacci
- RSI
- Gann
- ADXR
- Stochastics
- Volume
- Triangles
- Futures
- Cycles
- Volatility
- ZIGZAG
- MESA
- Retracement
- Aroon
INDICATORS LIST
LIST OF TOPICS
PRINT THIS ARTICLE
by Chaitali Mohile
The bullish rally of the S&P 600 Small Cap Index is likely to slow down near the previous high resistance.
Position: Hold
Chaitali Mohile
Active trader in the Indian stock markets since 2003 and a full-time writer. Trading is largely based upon technical analysis.
PRINT THIS ARTICLE
TECHNICAL ANALYSIS
S&P 600 Small Cap Index Approaching Resistance
02/13/11 09:24:22 AMby Chaitali Mohile
The bullish rally of the S&P 600 Small Cap Index is likely to slow down near the previous high resistance.
Position: Hold
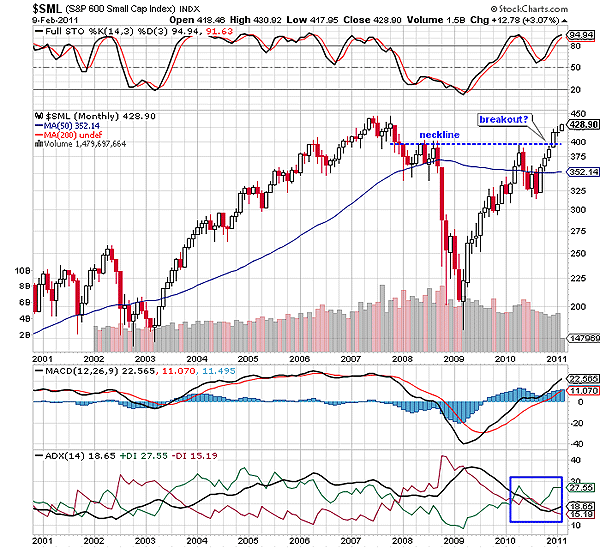
| On the monthly time frame in Figure 1, the Standard & Poor's 600 Small Cap Index ($SML) has formed an inverted head & shoulders with the neckline resistance at 400 levels. This formation is a bullish reversal as it breaks in an upward direction. Although the pattern is commonly found on the daily and weekly time frames, its appearance on the monthly time frame is considered to be a major event that starts a fresh long-term bullish phase for the particular stock/index. The left shoulder was not sharp due to the immediate support of 50-day moving average (MA). The support level was violated and $SML plunged to a new low below 200 levels. Note the extremely bearish indicators in Figure 1. An oversold stochastic (14,3,3), a highly overheated bearish trend indicated by the average directional index (ADX) (14), and the negative moving average convergence/divergence (MACD) (12,26,9) began a fresh pullback rally. The formation of the head attracted buyers, which you can see by the increase in volume. |
| Soon $SML surged towards the neckline resistance, completing the inverted head & shoulders formation (Figure 1). The index has already broke upward, reversing the previous downtrend. The ADX (14) at 18 levels shows huge buying pressure (green line) and weakening selling pressure (red line). Although $SML has rallied 28 points from its neckline support, the major resistance of the previous high is only a few points ahead. In 2007, $SML plunged from the 450 levels, indicating a top formation and initiating a major bearish phase. |

|
| FIGURE 1: $SML, MONTHLY |
| Graphic provided by: StockCharts.com. |
| |
| Therefore, the current breakout rally is likely to face huge selling pressure at this level (450). The bullish stochastic oscillator and positive MACD (12,26,9) are likely to escort the existing breakout rally as the uptrend is yet to develop. In such a scenario, calculating a potential target for the inverted head & shoulder formation would be unfair. However, a bullish breakout of the historical resistance would boost the rally; traders can look forward to measure the minimum estimated level by adding the length of the head to the breakout point near the neckline. |

|
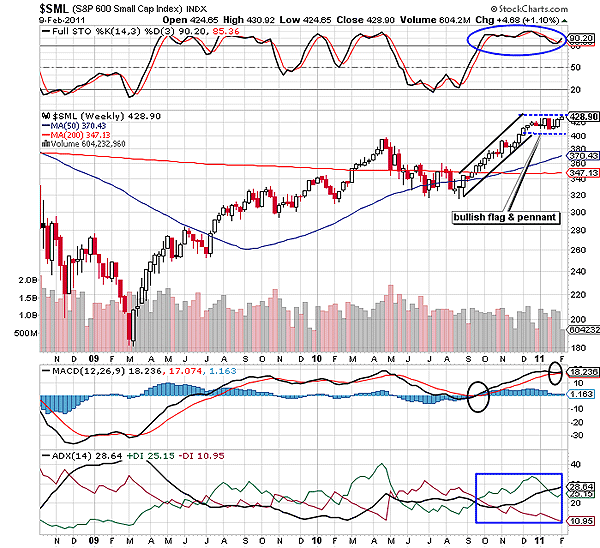
| FIGURE 2: $SML, WEEKLY. The stochastic oscillator is consistently moving in the highly overbought region. The two circles of the MACD (12,26,9) show the changing conditions, with the former the bullish crossover and the latter suggesting that the MACD is likely to establish support at the trigger line. |
| Graphic provided by: StockCharts.com. |
| |
| On the weekly time frame in Figure 2, $SML has formed a bullish flag & pennant -- a bullish continuous formation. All the three indicators are healthily bullish, which would add flavor to an upward breakout of the pattern. The developing uptrend would surge further as the pattern breaks north; 420 - 320 = 100 is the length of the flagpole, and by adding this length to the breakout point at 428, we get a target of 528. But as mentioned earlier, the long-term previous high at 450 levels is likely to suppress the breakout rally. After the confirmed breakout of the flag & pennant formation, the very short-term traders can trigger the long position with the small target of 450 levels. |
| Although $SML has formed two important formations on both time frames, the robust long-term resistance would restrict the current rally. The breakout rallies are likely to consolidate for a while or would retrace a few points before breaching resistance. |
Active trader in the Indian stock markets since 2003 and a full-time writer. Trading is largely based upon technical analysis.
| Company: | Independent |
| Address: | C1/3 Parth Indraprasth Towers. Vastrapur |
| Ahmedabad, Guj 380015 | |
| E-mail address: | chaitalimohile@yahoo.co.in |
Traders' Resource Links | |
| Independent has not added any product or service information to TRADERS' RESOURCE. | |
Click here for more information about our publications!
PRINT THIS ARTICLE

Request Information From Our Sponsors
- StockCharts.com, Inc.
- Candle Patterns
- Candlestick Charting Explained
- Intermarket Technical Analysis
- John Murphy on Chart Analysis
- John Murphy's Chart Pattern Recognition
- John Murphy's Market Message
- MurphyExplainsMarketAnalysis-Intermarket Analysis
- MurphyExplainsMarketAnalysis-Visual Analysis
- StockCharts.com
- Technical Analysis of the Financial Markets
- The Visual Investor
- VectorVest, Inc.
- Executive Premier Workshop
- One-Day Options Course
- OptionsPro
- Retirement Income Workshop
- Sure-Fire Trading Systems (VectorVest, Inc.)
- Trading as a Business Workshop
- VectorVest 7 EOD
- VectorVest 7 RealTime/IntraDay
- VectorVest AutoTester
- VectorVest Educational Services
- VectorVest OnLine
- VectorVest Options Analyzer
- VectorVest ProGraphics v6.0
- VectorVest ProTrader 7
- VectorVest RealTime Derby Tool
- VectorVest Simulator
- VectorVest Variator
- VectorVest Watchdog
