

HOT TOPICS LIST
- MACD
- Fibonacci
- RSI
- Gann
- ADXR
- Stochastics
- Volume
- Triangles
- Futures
- Cycles
- Volatility
- ZIGZAG
- MESA
- Retracement
- Aroon
INDICATORS LIST
LIST OF TOPICS
PRINT THIS ARTICLE
by Alan R. Northam
The long-term uptrend of AT&T looks to be mature and starting the long process of rolling over to the downside.
Position: N/A
Alan R. Northam
Alan Northam lives in the Dallas, Texas area and as an electronic engineer gave him an analytical mind from which he has developed a thorough knowledge of stock market technical analysis. His abilities to analyze the future direction of the stock market has allowed him to successfully trade of his own portfolio over the last 30 years. Mr. Northam is now retired and trading the stock market full time. You can reach him at inquiry@tradersclassroom.com or by visiting his website at http://www.tradersclassroom.com. You can also follow him on Twitter @TradersClassrm.
PRINT THIS ARTICLE
LIN. REGTREND
AT&T Is Rolling Over
02/10/11 08:36:52 AMby Alan R. Northam
The long-term uptrend of AT&T looks to be mature and starting the long process of rolling over to the downside.
Position: N/A
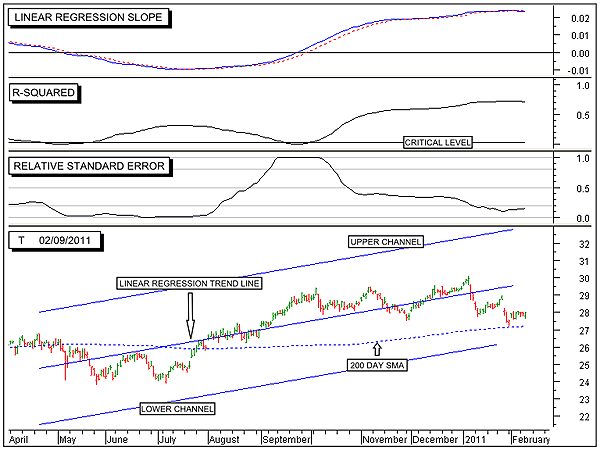
| Figure 1 shows the long-term picture of AT&T, stock symbol (T). The bottom window of Figure 1 shows the daily trading bars along with the 200-day linear regression trendline and its upper and lower channel lines. Note that the regression line shows that the long-term trend of AT&T remains in a long-term uptrend. |
|
| FIGURE 1: T, DAILY. This chart shows the daily price chart of AT&T in the bottom window along with the 200-day linear regression trendline and its upper and lower channel lines, the linear regression slope indicator in the top window, the R-squared indicator in the second window, and the relative standard error indicator in the third. |
| Graphic provided by: MetaStock. |
| |
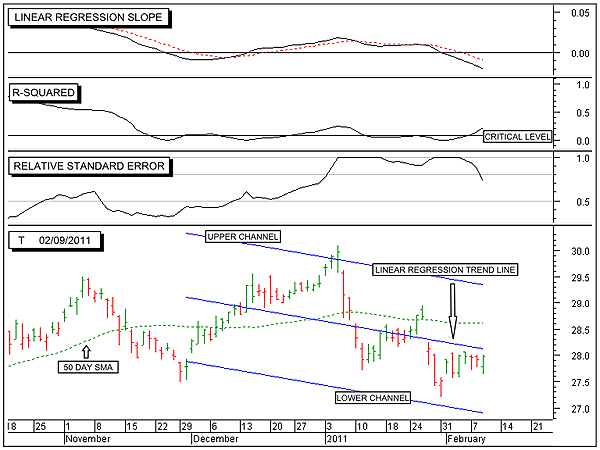
| The linear regression slope indicator in the top window is currently above its zero line but is starting to roll over downward. This indicates that price is no longer accelerating upward. If this indicator continues to roll over, price will soon start to decelerate over the long term. Note that price deceleration is the first step in a reversal of trend. The R-squared indicator is shown in the second window from the top. This indicator is well above its critical level, indicating a very strong uptrend in progress. However, the R-squared indicator also looks to be in the process of rolling over. If this indicator starts to point downward, it will be a sign that the uptrend is losing strength. The third window from the top shows the relative standard error indicator. This indicator is currently below 0.2, indicating low volatility. Low volatility is a sign that the current trend should remain in progress. However, if the long-term trend is truly starting to roll over, then volatility should start to increase soon. The long-term statistical analysis shows a strong uptrend in progress. However, this trend looks to be mature and is starting to weaken. Figure 2 shows AT&T over the intermediate term. The bottom window of Figure 2 shows the daily price bars along with the 50-day linear regression trendline along with its upper and lower channel lines. Note the linear regression trendline is showing that the intermediate-term trend is in the downward direction. |
|
| FIGURE 2: T, DAILY. This chart shows the daily price chart of AT&T in the bottom window along with the 50-day linear regression trendline and its upper and lower channel lines, the linear regression slope indicator in the top window, the R-squared indicator in the second window, and the relative standard error indicator in the third. |
| Graphic provided by: MetaStock. |
| |
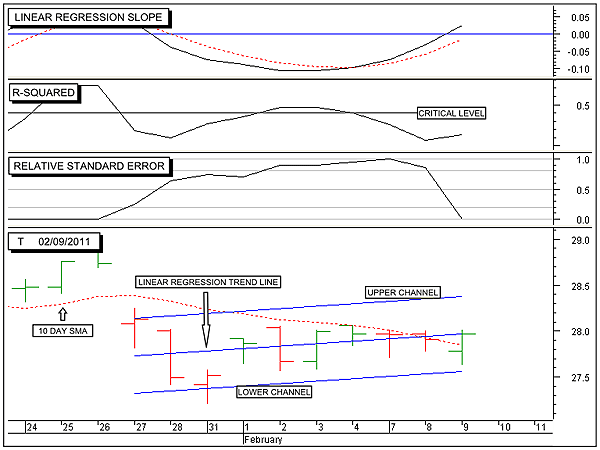
| The top window again shows the 50-day linear regression slope indicator. Note that this indicator moved below its zero line at the end of January 2011, signaling the beginning of an intermediate-term downtrend. The next lower window is that of the R-squared indicator. This indicator is a measure of the strength of trend. Note this indicator moved above its critical level in early February 2011, indicating a strong intermediate-term downtrend in play. The third window down shows the relative standard error indicator over the intermediate-term trend. This indicator is in the process of moving lower as the newly established intermediate-term downtrend continues to develop into a strong downtrend. The intermediate-term statistical analysis shows that AT&T is now in a newly established intermediate-term downtrend. Figure 3 shows the short-term trend of AT&T. On the price chart, in the bottom window I have shown the 10-day linear regression trendline along with its upper and lower channel lines. The linear regression trend line continues to point down, indicating that the short-term trend is down. |
|
| FIGURE 3: T, DAILY. This chart shows the daily price chart of AT&T in the bottom window along with the 10-day linear regression trendline and its upper and lower channel lines, the linear regression slope indicator in the top window, the R-squared indicator in the second window, and the relative standard error indicator in the third. |
| Graphic provided by: MetaStock. |
| |
| In the top window I have shown the linear regression slope indicator. Note this indicator has now moved above its zero line, indicating a short-term corrective uptrend is developing. The next lower window shows the R-squared indicator. This indicator is currently below its critical level, indicating a weak upward corrective trend in play. However, note since the short-term upward corrective trend has just gotten started, it could strengthen in the days ahead. The third window down from the top shows the relative standard error indicator. This indicator shows low volatility, suggesting that the newly established short-term upward corrective trend should continue in the days ahead. The short-term statistical analysis shows a new weak upward corrective trend in progress. |
| In conclusion, the long-term statistical analysis shows that AT&T has started the long process of rolling over to the downside and has already recently established itself in an intermediate-term downward. Over the short term, however, AT&T has entered into a corrective uptrend to recover some of its recent losses. |
Alan Northam lives in the Dallas, Texas area and as an electronic engineer gave him an analytical mind from which he has developed a thorough knowledge of stock market technical analysis. His abilities to analyze the future direction of the stock market has allowed him to successfully trade of his own portfolio over the last 30 years. Mr. Northam is now retired and trading the stock market full time. You can reach him at inquiry@tradersclassroom.com or by visiting his website at http://www.tradersclassroom.com. You can also follow him on Twitter @TradersClassrm.
| Garland, Tx | |
| Website: | www.tradersclassroom.com |
| E-mail address: | inquiry@tradersclassroom.com |
Click here for more information about our publications!
PRINT THIS ARTICLE

Request Information From Our Sponsors
- StockCharts.com, Inc.
- Candle Patterns
- Candlestick Charting Explained
- Intermarket Technical Analysis
- John Murphy on Chart Analysis
- John Murphy's Chart Pattern Recognition
- John Murphy's Market Message
- MurphyExplainsMarketAnalysis-Intermarket Analysis
- MurphyExplainsMarketAnalysis-Visual Analysis
- StockCharts.com
- Technical Analysis of the Financial Markets
- The Visual Investor
- VectorVest, Inc.
- Executive Premier Workshop
- One-Day Options Course
- OptionsPro
- Retirement Income Workshop
- Sure-Fire Trading Systems (VectorVest, Inc.)
- Trading as a Business Workshop
- VectorVest 7 EOD
- VectorVest 7 RealTime/IntraDay
- VectorVest AutoTester
- VectorVest Educational Services
- VectorVest OnLine
- VectorVest Options Analyzer
- VectorVest ProGraphics v6.0
- VectorVest ProTrader 7
- VectorVest RealTime Derby Tool
- VectorVest Simulator
- VectorVest Variator
- VectorVest Watchdog