HOT TOPICS LIST
- MACD
- Fibonacci
- RSI
- Gann
- ADXR
- Stochastics
- Volume
- Triangles
- Futures
- Cycles
- Volatility
- ZIGZAG
- MESA
- Retracement
- Aroon
INDICATORS LIST
LIST OF TOPICS
PRINT THIS ARTICLE
by Koos van der Merwe
The war against terrorism in the world is causing the US Army to use robots more and more.
Position: Accumulate
Koos van der Merwe
Has been a technical analyst since 1969, and has worked as a futures and options trader with First Financial Futures in Johannesburg, South Africa.
PRINT THIS ARTICLE
RSI
Robots For The Military
02/10/11 08:12:12 AMby Koos van der Merwe
The war against terrorism in the world is causing the US Army to use robots more and more.
Position: Accumulate
| In a recent interview on CNBC, the use of robots in the US armed forces was stressed, to the extent that the person interviewed said that he foresaw one robot to every three soldiers in the very near future. The companies building these robots are iRobot Corp (IRBT) and Aerovironment Inc. (AVAV). According to the interview, AVAV develops and produces unmanned aircraft systems. The US Army wants to increase dramatically the number of small unmanned aircraft in the hands of its soldiers. "And it could be big business," the interview subject added. iRobot Corp. (IRBT), however, manufactures a small robot that serves as an extra pair of eyes in the field. The device is an inexpensive hand-held scout that any soldier can carry into battle and use to find enemy combatants, traps, or other dangers. "Chances are we'll see these 'bots driven into the rough and explosive areas where they're needed most," the interview subject concluded. Obviously, this is the way of the future. Investing in these companies should prove highly profitable. What do the charts say? |

|
| FIGURE 1: AVAV, WEEKLY |
| Graphic provided by: AdvancedGET. |
| |
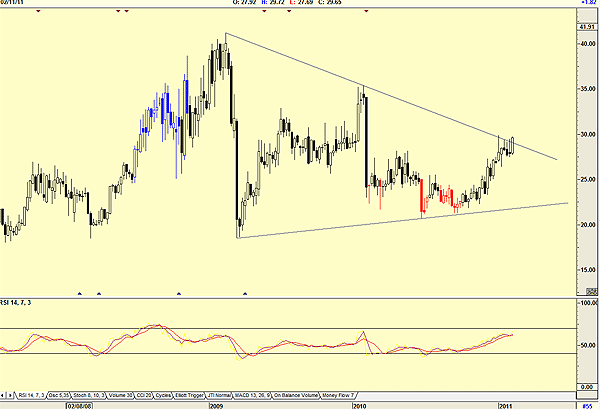
| Figure 1, a weekly chart of Aerovironment, shows excessive volatility, a perfect system for traders but not for investors. With the relative strength index (RSI) looking bullish, however, and what appears to be a break above a resistance trendline, it does look promising. |

|
| FIGURE 2: AVAV, DAILY |
| Graphic provided by: AdvancedGET. |
| |
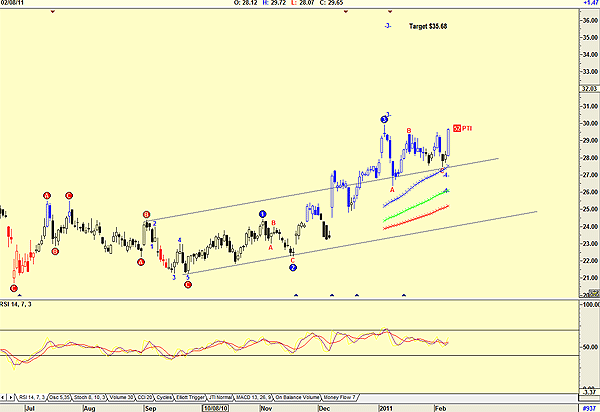
| A daily chart with an Elliott wave count, on the other hand, does suggest a target of $38.65 with a probability Index of 52 (Figure 2). The chart suggests that wave 4 is not complete, so the possibility of some downside does exist, although the support line shown could act as a barrier to complete the fourth-wave targets shown. The RSI is also drifting downward, suggesting negativity. Where Aerovironment manufactures robots that fly, iRobot manufactures robots that work on the ground. They have also diversified into manufacturing robots for cleaning the home, probably one of the reasons their chart shows growth. |

|
| FIGURE 3: IRBT, WEEKLY |
| Graphic provided by: AdvancedGET. |
| |
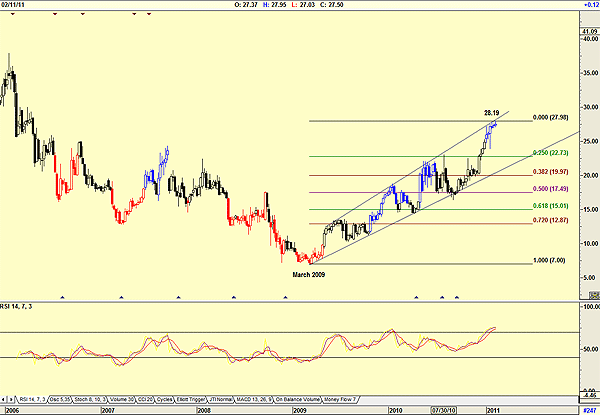
| Figure 3, a weekly chart, shows how the price fell as the market fell into March 2009, and the recovery since then. The RSI is suggesting a correction could be in the works. The Fibonacci retracement suggests $22.73 as a target. |

|
| FIGURE 4: IRBT, DAILY |
| Graphic provided by: AdvancedGET. |
| |
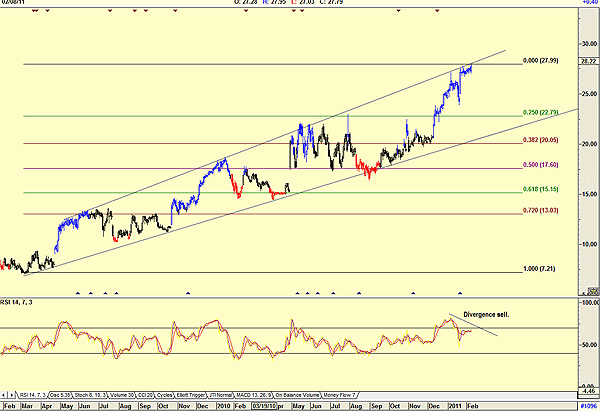
| Figure 4, a daily chart of iRobot, shows the RSI giving a divergence sell signal. The Fibonacci retracement is suggesting a fall to $22.79. Of the two companies, I would prefer to hold iRobot shares, in spite of the US military stating that they are going to increase their purchase of robots, simply because they have expanded into the home market. Both companies fundamentally have a good future ahead of them. Charts, however, show that iRobot is the better share to own. |
Has been a technical analyst since 1969, and has worked as a futures and options trader with First Financial Futures in Johannesburg, South Africa.
| Address: | 3256 West 24th Ave |
| Vancouver, BC | |
| Phone # for sales: | 6042634214 |
| E-mail address: | petroosp@gmail.com |
Click here for more information about our publications!
Comments

Request Information From Our Sponsors
- VectorVest, Inc.
- Executive Premier Workshop
- One-Day Options Course
- OptionsPro
- Retirement Income Workshop
- Sure-Fire Trading Systems (VectorVest, Inc.)
- Trading as a Business Workshop
- VectorVest 7 EOD
- VectorVest 7 RealTime/IntraDay
- VectorVest AutoTester
- VectorVest Educational Services
- VectorVest OnLine
- VectorVest Options Analyzer
- VectorVest ProGraphics v6.0
- VectorVest ProTrader 7
- VectorVest RealTime Derby Tool
- VectorVest Simulator
- VectorVest Variator
- VectorVest Watchdog
- StockCharts.com, Inc.
- Candle Patterns
- Candlestick Charting Explained
- Intermarket Technical Analysis
- John Murphy on Chart Analysis
- John Murphy's Chart Pattern Recognition
- John Murphy's Market Message
- MurphyExplainsMarketAnalysis-Intermarket Analysis
- MurphyExplainsMarketAnalysis-Visual Analysis
- StockCharts.com
- Technical Analysis of the Financial Markets
- The Visual Investor
