HOT TOPICS LIST
- MACD
- Fibonacci
- RSI
- Gann
- ADXR
- Stochastics
- Volume
- Triangles
- Futures
- Cycles
- Volatility
- ZIGZAG
- MESA
- Retracement
- Aroon
INDICATORS LIST
LIST OF TOPICS
PRINT THIS ARTICLE
by Donald W. Pendergast, Jr.
How high is high, anyway? Shares of Teradyne just seem to keep cranking higher -- and higher. Is the stock a buy right now, and if not, why not?
Position: N/A
Donald W. Pendergast, Jr.
Donald W. Pendergast is a financial markets consultant who offers specialized services to stock brokers and high net worth individuals who seek a better bottom line for their portfolios.
PRINT THIS ARTICLE
FIBONACCI
Is Teradyne Overextended Or Just Pausing?
02/09/11 08:35:49 AMby Donald W. Pendergast, Jr.
How high is high, anyway? Shares of Teradyne just seem to keep cranking higher -- and higher. Is the stock a buy right now, and if not, why not?
Position: N/A
| Lately, the Standard & Poor's 500 seems to be acting as if it's immune from the laws of market gravity, with many of its component stocks displaying charts that look an awful lot like the daily graph we're about to examine in shares of Teradyne (TER). |

|
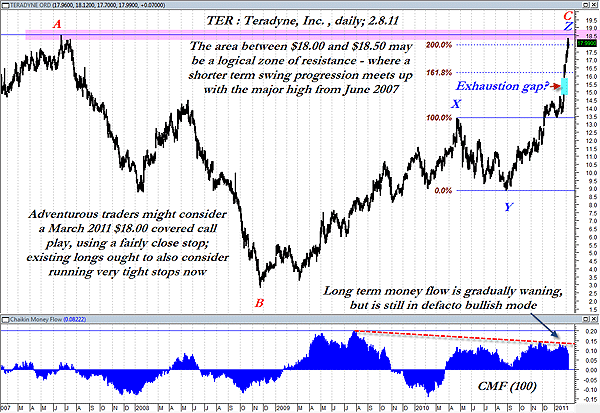
| FIGURE 1: TER, DAILY. With price now in near-parabolic mode after a possible exhaustion gap, existing longs should consider the possibility of scaling out of open positions to preserve any accumulated paper profits. The area between $18.00 to $18.50 should serve as major resistance. |
| Graphic provided by: MetaStock. |
| |
| Figure 1 is a daily chart that is clearly showing us where to expect to see a major, if not permanent, resistance zone. That area lies between $18.00 and $18.50 and is defined by the enormous ABC swing staring at the June 2007 all-time high of $18.53 (point A), the major low at point B ($2.80) and the recent high of $18.35 (point C) and also by the more recent XYZ set of swings (labeled in blue) that have come to an interim halt just beyond the Fibonacci 200% extension level of the XY swing and just a bit shy of the 100% Fib retracement of swing AB. Given that the stock is experiencing a steady erosion in its long-term money flow trend (see the Chaikin money flow (CMF)(100) histogram at the bottom of the chart) and that the stock may have also posted an exhaustion gap (see light blue rectangle in the recent gap area of the chart), this entire scenario should be providing existing long holders of TER ample reason to start running much closer trailing stops, if not actually start scaling out of current long TER positions. The S&P 500 and other key US stock indexes have been showing remarkable resiliency lately, and no one actually knows when these markets will start to correct. Some analysts believe the turn is long overdue, while others are looking for a run toward 1400.00 in the S&P before a major correction ensues. Right now, adventurous traders might consider buying a March 2011 TER $18.00 covered call for $17.25 or better, running a fairly close trailing stop on the position. If the stock is called away at March expiration, the trader will stand to garner an annualized return of about 42.95% (before commissions) for this 37-day commitment of time and trading capital. See Figure 2. Given the seemingly overextended nature of TER's daily chart, however, most traders may find that standing aside is the preferred course of action here, as the risks of a sudden (and potentially violent) broad market reversal would seem to far outweigh the potential benefits of such an attractive (hypothetical) rate of return. As in most things trading-related, the more conservative and highly disciplined you are, the greater your chances for long-term success and longevity in the markets may be. |

|
| FIGURE 2: TER, OPTIONS. Bid-ask spreads are a bit wider than ideal in TER equity options, meaning that prospective covered-call buyers should be prepared to work their bid aggressively in order to get a decent fill. |
| Graphic provided by: Thinkorswim. |
| |
Donald W. Pendergast is a financial markets consultant who offers specialized services to stock brokers and high net worth individuals who seek a better bottom line for their portfolios.
| Title: | Writer, market consultant |
| Company: | Linear Trading Systems LLC |
| Jacksonville, FL 32217 | |
| Phone # for sales: | 904-239-9564 |
| E-mail address: | lineartradingsys@gmail.com |
Traders' Resource Links | |
| Linear Trading Systems LLC has not added any product or service information to TRADERS' RESOURCE. | |
Click here for more information about our publications!
Comments

Request Information From Our Sponsors
- VectorVest, Inc.
- Executive Premier Workshop
- One-Day Options Course
- OptionsPro
- Retirement Income Workshop
- Sure-Fire Trading Systems (VectorVest, Inc.)
- Trading as a Business Workshop
- VectorVest 7 EOD
- VectorVest 7 RealTime/IntraDay
- VectorVest AutoTester
- VectorVest Educational Services
- VectorVest OnLine
- VectorVest Options Analyzer
- VectorVest ProGraphics v6.0
- VectorVest ProTrader 7
- VectorVest RealTime Derby Tool
- VectorVest Simulator
- VectorVest Variator
- VectorVest Watchdog
- StockCharts.com, Inc.
- Candle Patterns
- Candlestick Charting Explained
- Intermarket Technical Analysis
- John Murphy on Chart Analysis
- John Murphy's Chart Pattern Recognition
- John Murphy's Market Message
- MurphyExplainsMarketAnalysis-Intermarket Analysis
- MurphyExplainsMarketAnalysis-Visual Analysis
- StockCharts.com
- Technical Analysis of the Financial Markets
- The Visual Investor
