HOT TOPICS LIST
- MACD
- Fibonacci
- RSI
- Gann
- ADXR
- Stochastics
- Volume
- Triangles
- Futures
- Cycles
- Volatility
- ZIGZAG
- MESA
- Retracement
- Aroon
INDICATORS LIST
LIST OF TOPICS
PRINT THIS ARTICLE
by Alan R. Northam
The Dow Jones Transportation Average Diffusion Index suggests that the transportation market sector is in an established intermediate-term downward trend.
Position: N/A
Alan R. Northam
Alan Northam lives in the Dallas, Texas area and as an electronic engineer gave him an analytical mind from which he has developed a thorough knowledge of stock market technical analysis. His abilities to analyze the future direction of the stock market has allowed him to successfully trade of his own portfolio over the last 30 years. Mr. Northam is now retired and trading the stock market full time. You can reach him at inquiry@tradersclassroom.com or by visiting his website at http://www.tradersclassroom.com. You can also follow him on Twitter @TradersClassrm.
PRINT THIS ARTICLE
LIN. REGTREND
Transportation Sector In Downtrend
02/08/11 09:30:32 AMby Alan R. Northam
The Dow Jones Transportation Average Diffusion Index suggests that the transportation market sector is in an established intermediate-term downward trend.
Position: N/A
| According to Martin Pring in his work "Technical Analysis Explained," a diffusion indicator is an oscillator made of a basket of securities that make up an index and often measures the part of the market that is heading up. "An example might be the percentage of the 30 stocks comprising the Dow Jones Industrial Average that are above their 30-day moving averages," Pring notes. |
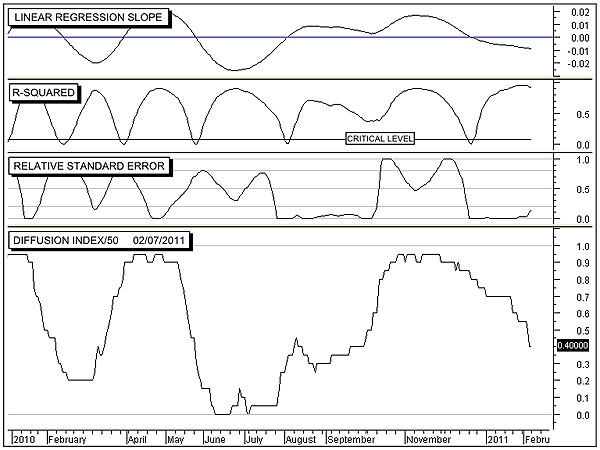
| The statistical diffusion indicator I have developed in the bottom window of Figure 1 is an oscillator that moves between zero percent (0) and 100% (1.0), constructed of the individual Dow Jones Transportation Average (DJTA) securities. The indicator measures the percentage of the Dow transport stocks whose 50-day linear regression slope indicator is above zero and whose 50-day R-squared indicator is above its critical level. Thus, this statistical diffusion indicator is made up of a basket of stocks that individually are in strong intermediate-term uptrends. The current reading of 0.40 indicates that only 40% of the stocks within the DJTA remain in strong uptrends. |

|
| FIGURE 1: DJTA DIFFUSION INDEX, DAILY. The bottom window shows the DJTA diffusion index. The top window shows the linear regression slope indicator, the second lower window shows that R-squared indicator, and the third lower window the relative standard error indicator. |
| Graphic provided by: MetaStock. |
| |
| The 50-day linear regression slope indicator in the top window is currently below its zero line and moving lower. This indicates that the DJTA diffusion index is in an intermediate-term downtrend. The 50-day R-squared indicator is currently above 0.9, indicating a strong downtrend for the diffusion index. However, I also notice that this indicator is starting to turn. This is an indication that the current leg of the intermediate-term downward rally is in its terminal stage. The 50-day relative standard error indicator is currently below 0.2, indicating extremely low volatility. Low volatility from a statistics point of view confirms that a strong trend is in place. A rapid change to a high volatility state indicates a change in trend ahead. Note that the relative standard error indicator is now starting to rise. This is an early warning of a change in trend. Note that a change in trend does not necessarily mean a reversal in trend. A change from a downtrending diffusion index to a sideways moving index is also a change. |
| In conclusion, the statistical analysis of the diffusion index suggests that the DJTA is in an established downtrend with only 40% of the stocks within the index remaining in uptrends. The diffusion index remains in a strong downtrend, indicating that the transportation market sector will most likely continue in a downtrend. However, volatility is starting to show up, which means that the transportation sector could experience a bounce in the not-too-distant future to correct some of its losses. |
Alan Northam lives in the Dallas, Texas area and as an electronic engineer gave him an analytical mind from which he has developed a thorough knowledge of stock market technical analysis. His abilities to analyze the future direction of the stock market has allowed him to successfully trade of his own portfolio over the last 30 years. Mr. Northam is now retired and trading the stock market full time. You can reach him at inquiry@tradersclassroom.com or by visiting his website at http://www.tradersclassroom.com. You can also follow him on Twitter @TradersClassrm.
| Garland, Tx | |
| Website: | www.tradersclassroom.com |
| E-mail address: | inquiry@tradersclassroom.com |
Click here for more information about our publications!
PRINT THIS ARTICLE

Request Information From Our Sponsors
- StockCharts.com, Inc.
- Candle Patterns
- Candlestick Charting Explained
- Intermarket Technical Analysis
- John Murphy on Chart Analysis
- John Murphy's Chart Pattern Recognition
- John Murphy's Market Message
- MurphyExplainsMarketAnalysis-Intermarket Analysis
- MurphyExplainsMarketAnalysis-Visual Analysis
- StockCharts.com
- Technical Analysis of the Financial Markets
- The Visual Investor
- VectorVest, Inc.
- Executive Premier Workshop
- One-Day Options Course
- OptionsPro
- Retirement Income Workshop
- Sure-Fire Trading Systems (VectorVest, Inc.)
- Trading as a Business Workshop
- VectorVest 7 EOD
- VectorVest 7 RealTime/IntraDay
- VectorVest AutoTester
- VectorVest Educational Services
- VectorVest OnLine
- VectorVest Options Analyzer
- VectorVest ProGraphics v6.0
- VectorVest ProTrader 7
- VectorVest RealTime Derby Tool
- VectorVest Simulator
- VectorVest Variator
- VectorVest Watchdog
