HOT TOPICS LIST
- MACD
- Fibonacci
- RSI
- Gann
- ADXR
- Stochastics
- Volume
- Triangles
- Futures
- Cycles
- Volatility
- ZIGZAG
- MESA
- Retracement
- Aroon
INDICATORS LIST
LIST OF TOPICS
PRINT THIS ARTICLE
by Mike Carr, CMT
Equity traders have long used the volatility index to monitor the volatility of the market. Oil and gold have similar measures.
Position: N/A
Mike Carr, CMT
Mike Carr, CMT, is a member of the Market Technicians Association, and editor of the MTA's newsletter, Technically Speaking. He is also the author of "Smarter Investing in Any Economy: The Definitive Guide to Relative Strength Investing," and "Conquering the Divide: How to Use Economic Indicators to Catch Stock Market Trends."
PRINT THIS ARTICLE
Oil Has A VIX
02/08/11 11:53:15 AMby Mike Carr, CMT
Equity traders have long used the volatility index to monitor the volatility of the market. Oil and gold have similar measures.
Position: N/A
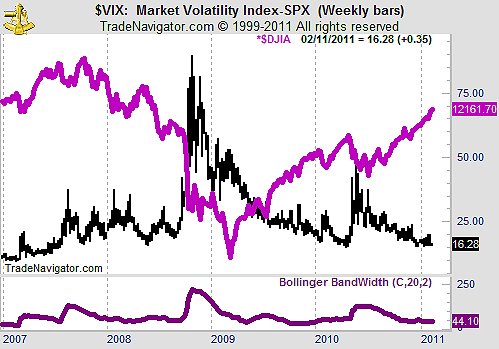
| The CBOE Volatility Index (VIX) is a widely followed tool among stock market investors. Sometimes called the "fear index," it tends to go up when the market falls and the price of options increases, protecting against further losses. VIX is based upon the price of implied volatility in index options, and the historical pattern seems to show that investors pay more for options in bear markets than they do in bull markets. This behavior leads to an inverse relationship between VIX and the Standard & Poor's 500 (Figure 1) which, as all relationships, works sometimes and fails to work at other times. |

|
| FIGURE 1: S&P 500. The weekly chart of the VIX shows an inverse correlation with the S&P 500, represented by the purple line. |
| Graphic provided by: Trade Navigator. |
| |
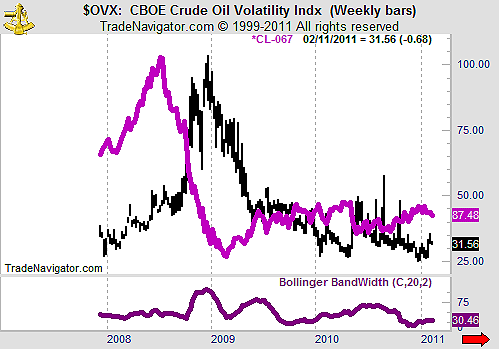
| The relationship is visually compelling, but admittedly inexact. The general trends are best viewed as inversely related. We also see the Bollinger Bandwidth in that chart, and the periods of low volatility are interrupted by relatively short bursts of high volatility. The CBOE Crude Oil Volatility Index is shown in Figure 2 and shows similar characteristics. |

|
| FIGURE 2: VIX. The CBOE Crude Oil Volatility Index is shown with the price of crude oil, represented by the purple line. |
| Graphic provided by: Trade Navigator. |
| |
| Volatility in crude oil is at a relatively low level based upon its historical value. Volatility can be measured by the Bollinger Bandwidth. In December 2010, that indicator reached an all-time low. Since that time, oil prices have been in an uptrend and the volatility index has been rising. |
| Traders in crude oil can use the CBOE Crude Oil Volatility Index in much the same way they would use the VIX to trade stocks. |
Mike Carr, CMT, is a member of the Market Technicians Association, and editor of the MTA's newsletter, Technically Speaking. He is also the author of "Smarter Investing in Any Economy: The Definitive Guide to Relative Strength Investing," and "Conquering the Divide: How to Use Economic Indicators to Catch Stock Market Trends."
| Website: | www.moneynews.com/blogs/MichaelCarr/id-73 |
| E-mail address: | marketstrategist@gmail.com |
Click here for more information about our publications!
Comments

|

Request Information From Our Sponsors
- StockCharts.com, Inc.
- Candle Patterns
- Candlestick Charting Explained
- Intermarket Technical Analysis
- John Murphy on Chart Analysis
- John Murphy's Chart Pattern Recognition
- John Murphy's Market Message
- MurphyExplainsMarketAnalysis-Intermarket Analysis
- MurphyExplainsMarketAnalysis-Visual Analysis
- StockCharts.com
- Technical Analysis of the Financial Markets
- The Visual Investor
- VectorVest, Inc.
- Executive Premier Workshop
- One-Day Options Course
- OptionsPro
- Retirement Income Workshop
- Sure-Fire Trading Systems (VectorVest, Inc.)
- Trading as a Business Workshop
- VectorVest 7 EOD
- VectorVest 7 RealTime/IntraDay
- VectorVest AutoTester
- VectorVest Educational Services
- VectorVest OnLine
- VectorVest Options Analyzer
- VectorVest ProGraphics v6.0
- VectorVest ProTrader 7
- VectorVest RealTime Derby Tool
- VectorVest Simulator
- VectorVest Variator
- VectorVest Watchdog
