HOT TOPICS LIST
- MACD
- Fibonacci
- RSI
- Gann
- ADXR
- Stochastics
- Volume
- Triangles
- Futures
- Cycles
- Volatility
- ZIGZAG
- MESA
- Retracement
- Aroon
INDICATORS LIST
LIST OF TOPICS
PRINT THIS ARTICLE
by Billy Williams
With the market trending higher and higher, February favors the short sellers.
Position: Hold
Billy Williams
Billy Williams has been trading the markets for 27 years, specializing in momentum trading with stocks and options.
PRINT THIS ARTICLE
SEASONAL TRADING
February Favors The Short Sellers
02/07/11 01:32:11 PMby Billy Williams
With the market trending higher and higher, February favors the short sellers.
Position: Hold
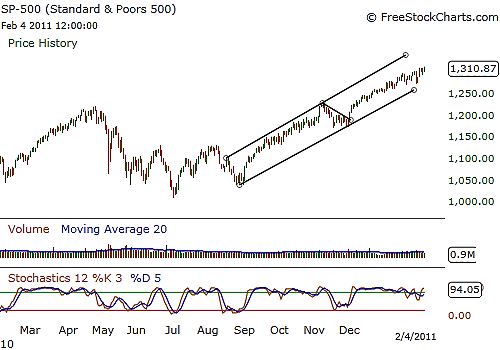
| Currently, the Standard & Poor's 500 is in a bullish price channel with only one pullback to its lower trendline, forming a flag pattern before continuing with its bullish run (Figure 1). From the pullback's low point on November 29, 2010, the S&P has rallied more than 123 points to its present level without any type of correction. This can be attributed to the December pattern, where fund managers typically run the market up artificially in order to improve their returns because they are financially incentivized by bonuses for achieving performance benchmarks for their respective funds and clients. As of late, the stock market has been on a steady run to the upside, kicking off the year to a good start. According to historical patterns, as detailed in the "Stock Trader's Almanac 2011," if the first five days of January finish up with a gain, then the rest of the year should be positive for the stock market. However, there is one weak link in the whole chain of the current uptrend, and that is February. February favors the short sellers, as it is historically the month where a pullback occurs, averaging -2.4% in the last 12 years. |

|
| FIGURE 1: S&P 500. The S&P has been trending higher but stochastics reveal it is highly overbought and is due for a pullback. |
| Graphic provided by: www.freestockcharts.com. |
| |
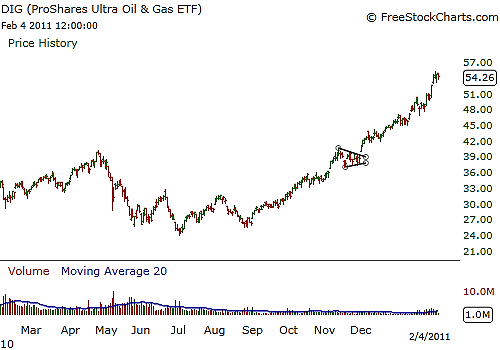
| Given how overbought the S&P 500 and the rest of the market have become, traders on the exchanges may take this opportunity to start adjusting their position, taking profits and moving their capital to more promising sectors. One of the sectors getting a lot of attention these days is oil. In early November, the Pro-Shares Ultra Oil & Gas exchange traded fund (DIG) peaked in price before selling off a bit and then consolidated into a bullish triangle (Figure 2). On December 1, 2010, DIG exploded upward through the upper trendline of the DIG's bullish triangle pattern at a price point of around $40.92, gaining 14 points in only two months. |

|
| FIGURE 2: DIG ETF. Forming a bullish triangle pattern, DIG exploded upward and achieved a quick 34% return in only two months. |
| Graphic provided by: www.freestockcharts.com. |
| |
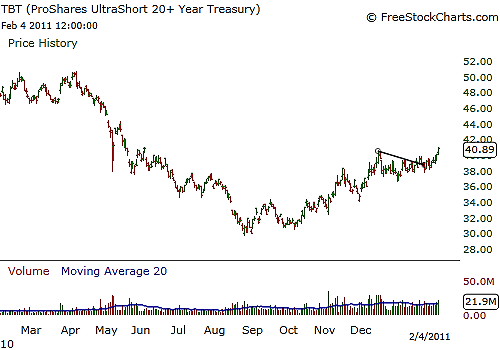
| Smart traders try to hedge their long positions by finding unrelated sectors to short and vice versa. One of those unrelated markets from resource-rich sectors is the bond market. The US bond market is such a market offering opportunities for a skilled technician, and at the rate the US is printing money to buy back bonds through quantitative easing, a new bubble in the bond market appears to be under way. However, this alone isn't a reason to trade the short side bonds; only its price action confirms whether this is a market in which you want to take a position. Currently, the ProShares Ultra Short 20 + Year Treasury ETF (TBT) has been on a steady decline as the price of bonds has remained high (Figure 3). After TBT hit a price low on August 25, 2010, its price action remained flat for a while but then began to firm up and rise. Since its low point, it has been making a series of steady higher highs and higher lows in its price action, revealing a bullish trend taking place. |

|
| FIGURE 3: TBT. A new bear trend in bonds may be unde rway as TBT, an exchange traded fund that shorts the bond market, formed a bullish flag as the bond market declines. |
| Graphic provided by: www.freestockcharts.com. |
| |
| From mid-December 2010 to early January 2011, a bullish flag pattern emerged where price then traded along the upper trendline for some weeks. This trading along a trendline was explained by legendary trader Richard Donchian as a sign that price would soon reverse and a new trend emerge. In this case, price consolidated in a short-term downtrend before trading up through the pattern's upper trendline in a forceful manner, establishing the new bull run. Be cautious in February about overexposing yourself to any longs and consider lightening your positions, taking profits, and redeploying them to new sectors where the promise of higher returns lies in wait. |
Billy Williams has been trading the markets for 27 years, specializing in momentum trading with stocks and options.
| Company: | StockOptionSystem.com |
| E-mail address: | stockoptionsystem.com@gmail.com |
Traders' Resource Links | |
| StockOptionSystem.com has not added any product or service information to TRADERS' RESOURCE. | |
Click here for more information about our publications!
PRINT THIS ARTICLE

Request Information From Our Sponsors
- StockCharts.com, Inc.
- Candle Patterns
- Candlestick Charting Explained
- Intermarket Technical Analysis
- John Murphy on Chart Analysis
- John Murphy's Chart Pattern Recognition
- John Murphy's Market Message
- MurphyExplainsMarketAnalysis-Intermarket Analysis
- MurphyExplainsMarketAnalysis-Visual Analysis
- StockCharts.com
- Technical Analysis of the Financial Markets
- The Visual Investor
- VectorVest, Inc.
- Executive Premier Workshop
- One-Day Options Course
- OptionsPro
- Retirement Income Workshop
- Sure-Fire Trading Systems (VectorVest, Inc.)
- Trading as a Business Workshop
- VectorVest 7 EOD
- VectorVest 7 RealTime/IntraDay
- VectorVest AutoTester
- VectorVest Educational Services
- VectorVest OnLine
- VectorVest Options Analyzer
- VectorVest ProGraphics v6.0
- VectorVest ProTrader 7
- VectorVest RealTime Derby Tool
- VectorVest Simulator
- VectorVest Variator
- VectorVest Watchdog
