HOT TOPICS LIST
- MACD
- Fibonacci
- RSI
- Gann
- ADXR
- Stochastics
- Volume
- Triangles
- Futures
- Cycles
- Volatility
- ZIGZAG
- MESA
- Retracement
- Aroon
INDICATORS LIST
LIST OF TOPICS
PRINT THIS ARTICLE
by Andrew Hetherington
It's always very tricky playing long or short within the pattern. Here's an example with PMC-Sierra that demonstrates this scenario.
Position: N/A
Andrew Hetherington
Classic Dow Theorist who trades as a pure technician, using pattern recognition.
PRINT THIS ARTICLE
CHART ANALYSIS
Is PMC-Sierra Heading Higher or Lower?
02/20/02 02:33:27 PMby Andrew Hetherington
It's always very tricky playing long or short within the pattern. Here's an example with PMC-Sierra that demonstrates this scenario.
Position: N/A
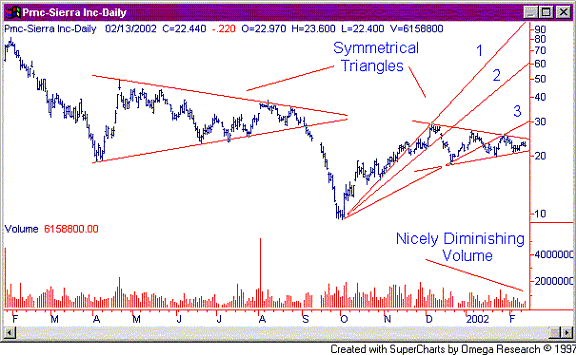
| In Figure 1, the two symmetrical triangles, which are only a few months apart, present an interesting situation. On the first example from April to August of 2001, we see an early warning signal that ID (impending doom) was upon us. Taking into account the general market direction as well as the huge volume on August 2 of almost 53 million shares without breaking topside, you were forced to consider shorting it within the pattern. This would have been a good decision. |
| There is no clear signal for the general direction of the market although we do know that it is up for now. We're waiting for the Dow and the Nasdaq to complete patterns before we can commit how far and have a definitive answer. |

|
| Figure 1: Daily chart for PMCS. |
| Graphic provided by: SuperCharts. |
| |
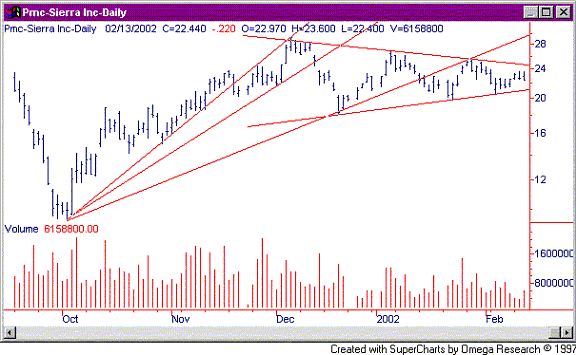
| Knowing the market is not going to fall apart gives us the impression that we should play PMCS long. I'm not convinced of this, even though the trend is up. A word of caution is necessary for those who are faint of heart. Playing within patterns is difficult at the best of times so be prepared to bail out if any of your lines are broken. A top line breakout is at $24.50 to go long and a bottom line breakout to go short is at $21.00. I recommend using these lines as stop-loss lines by adding or subtracting $0.40. I normally recommend playing exclusively with the trend. This is an exception to the rule since it's beginning to show weakness with an increase in volume today on the downside. In addition to this it has done a one-day reversal without the volume confirmation. Although extraordinary volume must accompany this pattern, it still indicates weakness when going above the previous day's high and closing below the previous day's low. Naturally, with this style of pattern a third fan line break has taken place as well, although not always the case it often does show this tendency when consolidating. |
 Figure 2: Daily chart for PMCS. My expectations are for the breakout to drop down to the $18.00 area before having a small pullback upwards toward $20.00 and then resume it's inevitable downward move to the $15.00 area. Naturally, if the move is hard and fast without a pullback I would recommend buying back the shares. I've always found it best to buy my shorts back on the first hard drop. |
| The general market condition could easily suck this weak equity upwards like a vacuum, but I still sense weakness. There was a very good recovery from $9.37 on October 2 to a high of $29.32 on December 6. Then this symmetrical triangle formed which showed indecision. My thoughts are down but we'll wait and see. If I'm right then this will be one time where you are playing against the trend, thus demonstrating the trickiness within the patterns. |
Classic Dow Theorist who trades as a pure technician, using pattern recognition.
| Toronto, Canada |
Click here for more information about our publications!
Comments
Date: 02/20/02Rank: 5Comment:
Date: 02/21/02Rank: 4Comment:
Date: 02/26/02Rank: 4Comment:

Request Information From Our Sponsors
- StockCharts.com, Inc.
- Candle Patterns
- Candlestick Charting Explained
- Intermarket Technical Analysis
- John Murphy on Chart Analysis
- John Murphy's Chart Pattern Recognition
- John Murphy's Market Message
- MurphyExplainsMarketAnalysis-Intermarket Analysis
- MurphyExplainsMarketAnalysis-Visual Analysis
- StockCharts.com
- Technical Analysis of the Financial Markets
- The Visual Investor
- VectorVest, Inc.
- Executive Premier Workshop
- One-Day Options Course
- OptionsPro
- Retirement Income Workshop
- Sure-Fire Trading Systems (VectorVest, Inc.)
- Trading as a Business Workshop
- VectorVest 7 EOD
- VectorVest 7 RealTime/IntraDay
- VectorVest AutoTester
- VectorVest Educational Services
- VectorVest OnLine
- VectorVest Options Analyzer
- VectorVest ProGraphics v6.0
- VectorVest ProTrader 7
- VectorVest RealTime Derby Tool
- VectorVest Simulator
- VectorVest Variator
- VectorVest Watchdog
