HOT TOPICS LIST
- MACD
- Fibonacci
- RSI
- Gann
- ADXR
- Stochastics
- Volume
- Triangles
- Futures
- Cycles
- Volatility
- ZIGZAG
- MESA
- Retracement
- Aroon
INDICATORS LIST
LIST OF TOPICS
PRINT THIS ARTICLE
by Donald W. Pendergast, Jr.
The bull market keeps hanging in there. Instead of trying to call the exact top, why not just try to make the most of the stocks that are still moving higher?
Position: Buy
Donald W. Pendergast, Jr.
Donald W. Pendergast is a financial markets consultant who offers specialized services to stock brokers and high net worth individuals who seek a better bottom line for their portfolios.
PRINT THIS ARTICLE
OPTIONS TRADING
Gannett High-Yield Covered Call Op
02/04/11 09:08:00 AMby Donald W. Pendergast, Jr.
The bull market keeps hanging in there. Instead of trying to call the exact top, why not just try to make the most of the stocks that are still moving higher?
Position: Buy
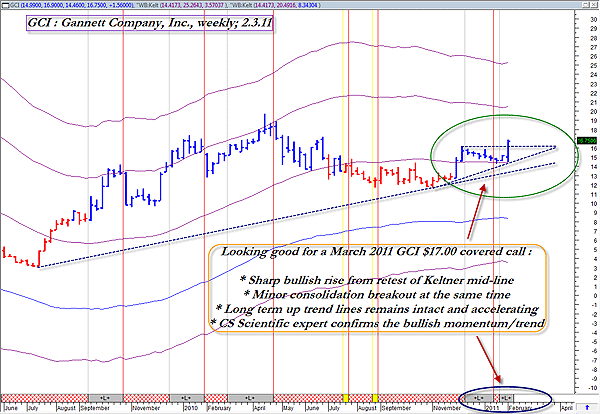
| The print media industry has been hit very hard over the last few years, with many old-line newspaper stalwarts either cutting back on operations or just shutting down completely. Gannett (GCI), best known for its "USA Today" newspaper, saw its share price cut by more than 95% between April 2004 and March 2009 before slowly regaining traction, eventually clawing its way back up to $16.75, where it sits today. While it may take a long time for shares of the stock to ever reach the $90 zone again, the fact remains that GCI is offering one of the better short-term covered-call plays available to savvy investors and traders. Here's a closer look in Figure 1. |

|
| FIGURE 1: GCI, WEEKLY. Even if you flunked your high school geometry class, you should still be able to see the bullish potential in this particular trade setup. When screening for covered-call candidates, always focus on liquid, large-cap names that feature super strong momentum and/or relative strength characteristics versus their parent indexes. |
| Graphic provided by: MetaStock. |
| Graphic provided by: MetaStock 11 CS Scientific expert advisor. |
| |
| Any time you can find a near-term covered-call setup offering an annualized rate of return of 40% (or better) in a liquid, big-cap stock, it always pays to do some further investigation to see if the risk-reward ratio is commensurate with such a fabulous opportunity to profit. In this case, a little extra due diligence appears to be well worth the effort, judging from the very solid technical posture of GCI on its weekly time frame. It looks like a very normal (and very bullish) breakout from a consolidation pattern that allowed for a minor retest of the Keltner midline and also provided the foundation for a wide-range breakout bar. All this is occurring even as the trendlines are beginning to accelerate higher and the CS Scientific expert advisor (standard in MetaStock 10 and 11) is confirming the strongly bullish trend/momentum characteristics in shares of this media giant. That's the technical side of the trade, but how good are the covered-call plays for GCI? |

|
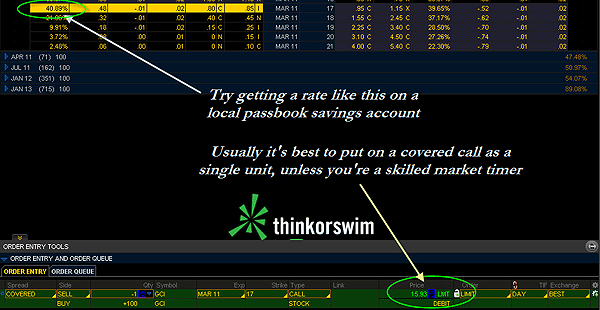
| FIGURE 2: COVERED CALL. Always make sure the potential rate of return on your covered calls are commensurate with the overall risk-reward profile of the trade setup. Only trade those stocks that have high average trading volume and also offer close bid-ask option spreads. GCI easily meets these qualifications. |
| Graphic provided by: Thinkorswim. |
| |
| Actually, they're also looking mighty fine; a slightly out-of-the-money covered call -- the March $17.00 -- is offering a potential for an annualized rate of return of more than 40% (before commissions) for a 42-day commitment of time and trading capital (Figure 2). The bid-ask spread on the $17.00 call is only a nickel, and that's just what we want to see so we can limit risk and maximize potential gains, should the trade go favorably. Limiting risk might mean nothing more difficult than using the new weekly uptrend line as a stop-loss barrier, just like a trailing stop. If GCI makes a weekly close below the line at anytime before March expiration (March 18, 2011), the big idea is to close the trade out, win, or lose. Unless GCI sells off especially hard (it could happen; remember, this is the stock market, where anything can happen), the losses will likely be modest and you can always regroup and search out for another promising trade setup. Of course, if GCI stays above the line, just hold the trade for as long as it does, rooting for it to close in-the-money by the third Friday in March. |
| If you have a $30,000 stock trading account and want to limit your risk to 1.5% of its value ($450), here's a rough guide to help you determine how many covered calls you could purchase on this setup: Let's say the nominal initial stop-loss (using the current position of the uptrend line) is about $13.90; using the risk profile graph in Thinkorswim, I was able to determine that such a stop-loss point would equate a $210 loss per covered call, before commissions. So if I was willing to risk $450 on this trade, I could go long two March $17.00 covered calls in GCI and still be within my risk tolerance. If your risk tolerance was only 1% of your account value ($300), then you'd only want to buy one covered call. Better safe than sorry -- it's no fun to miss out on a big winning trade, but it certainly beats having too large a position on when the market is setting up for a losing trade. Play it safe: Size your positions on the conservative side, no matter what you trade -- stocks, options, futures, forex, whatever. Over time, you may still be trading and making money long after the big risk-takers have closed out what was left of their own trading accounts. |
Donald W. Pendergast is a financial markets consultant who offers specialized services to stock brokers and high net worth individuals who seek a better bottom line for their portfolios.
| Title: | Writer, market consultant |
| Company: | Linear Trading Systems LLC |
| Jacksonville, FL 32217 | |
| Phone # for sales: | 904-239-9564 |
| E-mail address: | lineartradingsys@gmail.com |
Traders' Resource Links | |
| Linear Trading Systems LLC has not added any product or service information to TRADERS' RESOURCE. | |
Click here for more information about our publications!
PRINT THIS ARTICLE

Request Information From Our Sponsors
- VectorVest, Inc.
- Executive Premier Workshop
- One-Day Options Course
- OptionsPro
- Retirement Income Workshop
- Sure-Fire Trading Systems (VectorVest, Inc.)
- Trading as a Business Workshop
- VectorVest 7 EOD
- VectorVest 7 RealTime/IntraDay
- VectorVest AutoTester
- VectorVest Educational Services
- VectorVest OnLine
- VectorVest Options Analyzer
- VectorVest ProGraphics v6.0
- VectorVest ProTrader 7
- VectorVest RealTime Derby Tool
- VectorVest Simulator
- VectorVest Variator
- VectorVest Watchdog
- StockCharts.com, Inc.
- Candle Patterns
- Candlestick Charting Explained
- Intermarket Technical Analysis
- John Murphy on Chart Analysis
- John Murphy's Chart Pattern Recognition
- John Murphy's Market Message
- MurphyExplainsMarketAnalysis-Intermarket Analysis
- MurphyExplainsMarketAnalysis-Visual Analysis
- StockCharts.com
- Technical Analysis of the Financial Markets
- The Visual Investor
