HOT TOPICS LIST
- MACD
- Fibonacci
- RSI
- Gann
- ADXR
- Stochastics
- Volume
- Triangles
- Futures
- Cycles
- Volatility
- ZIGZAG
- MESA
- Retracement
- Aroon
INDICATORS LIST
LIST OF TOPICS
PRINT THIS ARTICLE
by Chaitali Mohile
Will DJIA carry forward the current bullishness in the long term?
Position: Hold
Chaitali Mohile
Active trader in the Indian stock markets since 2003 and a full-time writer. Trading is largely based upon technical analysis.
PRINT THIS ARTICLE
TECHNICAL ANALYSIS
DJIA Undergoing Healthy Rally
02/04/11 07:43:15 AMby Chaitali Mohile
Will DJIA carry forward the current bullishness in the long term?
Position: Hold
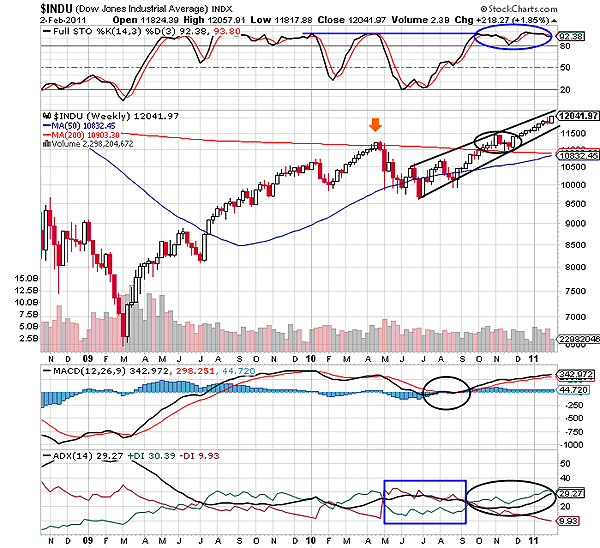
| After breaching the robust 200-day moving average (MA) resistance, the Dow Jones Industrial Average (DJIA) consolidated for about two months on its weekly time frame. A large bearish candle and the doji candles formed during consolidation in Figure 1 shows volatility. Earlier (April, 2010), the DJIA had plunged after hitting the 200-day MA resistance. This suggests that a strong bearish force existed at the resistance line. But the consolidation in October and November 2010 induced huge bullish pressure and broke upward, ignoring the bearish force of the 200-day MA resistance. Thereafter, DJIA surged above 11500 levels. We can see the full stochastic (14,3,3) is back in an overbought area and is likely to continue its highly bullish journey. The bullish breakout reversed the previous downtrend, as indicated by the average directional index (ADX) in Figure 1. |

|
| FIGURE 1: DJIA, WEEKLY |
| Graphic provided by: StockCharts.com. |
| |
| However, a rising wedge formed during the entire bullish rally from 9600 to 12041 levels is a point of concern. The formation is a bearish reversal and usually initiates a fresh bearish rally. Currently, the ADX (14) is highlighting a developing uptrend and the moving average convergence/divergence (MACD) (12,26,9) is positive. Therefore, the highly overbought stochastic oscillator in Figure 1 is the only bearish possibility that could support the bearish reversal formation on the price chart. Volumes were pretty encouraging, even though the rising wedge had formed. Hence, DJIA is likely to surge further in a very narrow range. The overall view on the weekly chart shows that DJIA is not ready for correction but would face high volatility due to the narrowing range. The important indications that traders need to remember are: 1. DJIA has to sustain within the two narrowing trendlines of the wedge. 2. Breaching of the lower trendline would result in a bearish breakout. 3. The breakout would be confirmed only if DJIA fails to reconvert the lower trendline resistance to support. |

|
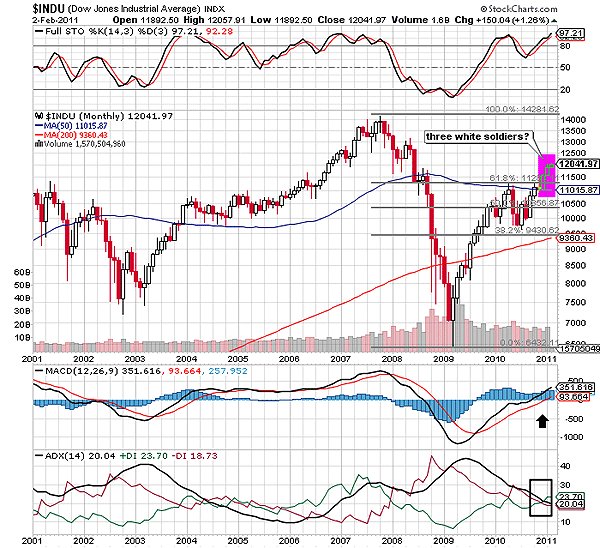
| FIGURE 2: DJIA, MONTHLY |
| Graphic provided by: StockCharts.com. |
| |
| On the monthly time frame in Figure 2 DJIA has surged above the 61.8% Fibonacci retracement levels and has established robust support on the 50-day moving average (MA). The upward rally that began in November 2010 has formed three white bullish candles in Figure 2 (see the purple block). The third white candle is getting built, which would later confirm if a three white soldiers candlestick pattern is formed. This candlestick pattern is a bullish trend reversal that boosts the price rally to move higher. According to the ADX (14) in Figure 2, the downtrend has weakened and the fresh uptrend is ready to develop. The buying pressure has to rocket for capturing the bullish trend. Therefore, the third candle would be the decision maker for DJIA. However, the MACD (12,26,9) is positive and is steeply moving above the zero line, indicating a positive momentum for the index. Though the stochastic oscillator is extremely overbought, the indicator is not reflecting any sign of the potential bearish move. In addition, the price rally has various supports. |
| Thus, DJIA is likely to remain in a healthy bullish mood for the longer period. The supports at different levels would prevent major damage for the index. |
Active trader in the Indian stock markets since 2003 and a full-time writer. Trading is largely based upon technical analysis.
| Company: | Independent |
| Address: | C1/3 Parth Indraprasth Towers. Vastrapur |
| Ahmedabad, Guj 380015 | |
| E-mail address: | chaitalimohile@yahoo.co.in |
Traders' Resource Links | |
| Independent has not added any product or service information to TRADERS' RESOURCE. | |
Click here for more information about our publications!
Comments
Date: 02/04/11Rank: 3Comment:

Request Information From Our Sponsors
- StockCharts.com, Inc.
- Candle Patterns
- Candlestick Charting Explained
- Intermarket Technical Analysis
- John Murphy on Chart Analysis
- John Murphy's Chart Pattern Recognition
- John Murphy's Market Message
- MurphyExplainsMarketAnalysis-Intermarket Analysis
- MurphyExplainsMarketAnalysis-Visual Analysis
- StockCharts.com
- Technical Analysis of the Financial Markets
- The Visual Investor
- VectorVest, Inc.
- Executive Premier Workshop
- One-Day Options Course
- OptionsPro
- Retirement Income Workshop
- Sure-Fire Trading Systems (VectorVest, Inc.)
- Trading as a Business Workshop
- VectorVest 7 EOD
- VectorVest 7 RealTime/IntraDay
- VectorVest AutoTester
- VectorVest Educational Services
- VectorVest OnLine
- VectorVest Options Analyzer
- VectorVest ProGraphics v6.0
- VectorVest ProTrader 7
- VectorVest RealTime Derby Tool
- VectorVest Simulator
- VectorVest Variator
- VectorVest Watchdog
