HOT TOPICS LIST
- MACD
- Fibonacci
- RSI
- Gann
- ADXR
- Stochastics
- Volume
- Triangles
- Futures
- Cycles
- Volatility
- ZIGZAG
- MESA
- Retracement
- Aroon
INDICATORS LIST
LIST OF TOPICS
PRINT THIS ARTICLE
by Mike Carr, CMT
Monthly charts can offer traders a different perspective.
Position: N/A
Mike Carr, CMT
Mike Carr, CMT, is a member of the Market Technicians Association, and editor of the MTA's newsletter, Technically Speaking. He is also the author of "Smarter Investing in Any Economy: The Definitive Guide to Relative Strength Investing," and "Conquering the Divide: How to Use Economic Indicators to Catch Stock Market Trends."
PRINT THIS ARTICLE
Looking At Oil For The Long Run
02/01/11 11:50:50 AMby Mike Carr, CMT
Monthly charts can offer traders a different perspective.
Position: N/A
| Futures trading usually involves leverage and risk management. Leverage means that small price changes can have a large impact on account equity, and risk management is required to ensure that small losses don't become large enough to destroy a trader's capital. Most traders will make decisions using daily, or even intraday charts, and few rarely step back to take a longer-term perspective. |
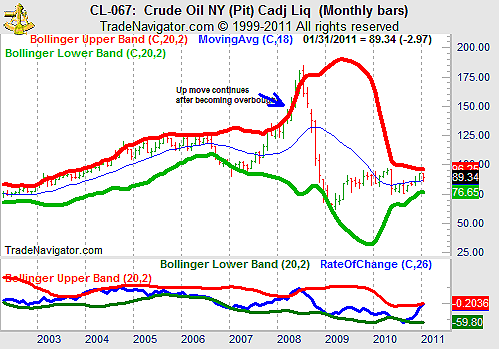
| Figure 1 shows a monthly chart of prices for a crude oil continuous price contract. Several lessons can be drawn from the chart. First is that futures markets tend to spend a great deal of time in trading ranges. We can easily spot several periods on the chart where prices move sideways. |

|
| FIGURE 1: CRUDE OIL, MONTHLY. Monthly charts offer a historical perspective and can help traders see the big picture behind shorter-term price moves. |
| Graphic provided by: Trade Navigator. |
| |
| Bollinger bands are included on the price chart to illustrate that volatility is relatively rare in the market. Most of the time, trading ranges seem to limit volatility. However, when a breakout occurs, it can go farther and last longer than traders would expect. Prices spent almost five months above the upper band in 2008, and the uptrend persisted for 10 months after the first break of that band. |
| It seems that the rate of change indicator behaves much like price does. High volatility seems to follow low volatility, as seen by the width of the Bollinger bands that envelop the indicator in the lower part of the chart. Visually, it appears that breaks of the bands actually offer timely signals for price moves. |
| Combining a daily chart, monthly charts, and weekly charts can offer valuable insights to trend-followers. |
Mike Carr, CMT, is a member of the Market Technicians Association, and editor of the MTA's newsletter, Technically Speaking. He is also the author of "Smarter Investing in Any Economy: The Definitive Guide to Relative Strength Investing," and "Conquering the Divide: How to Use Economic Indicators to Catch Stock Market Trends."
| Website: | www.moneynews.com/blogs/MichaelCarr/id-73 |
| E-mail address: | marketstrategist@gmail.com |
Click here for more information about our publications!
Comments
Date: 02/08/11Rank: 5Comment:

Request Information From Our Sponsors
- VectorVest, Inc.
- Executive Premier Workshop
- One-Day Options Course
- OptionsPro
- Retirement Income Workshop
- Sure-Fire Trading Systems (VectorVest, Inc.)
- Trading as a Business Workshop
- VectorVest 7 EOD
- VectorVest 7 RealTime/IntraDay
- VectorVest AutoTester
- VectorVest Educational Services
- VectorVest OnLine
- VectorVest Options Analyzer
- VectorVest ProGraphics v6.0
- VectorVest ProTrader 7
- VectorVest RealTime Derby Tool
- VectorVest Simulator
- VectorVest Variator
- VectorVest Watchdog
- StockCharts.com, Inc.
- Candle Patterns
- Candlestick Charting Explained
- Intermarket Technical Analysis
- John Murphy on Chart Analysis
- John Murphy's Chart Pattern Recognition
- John Murphy's Market Message
- MurphyExplainsMarketAnalysis-Intermarket Analysis
- MurphyExplainsMarketAnalysis-Visual Analysis
- StockCharts.com
- Technical Analysis of the Financial Markets
- The Visual Investor
