

HOT TOPICS LIST
- MACD
- Fibonacci
- RSI
- Gann
- ADXR
- Stochastics
- Volume
- Triangles
- Futures
- Cycles
- Volatility
- ZIGZAG
- MESA
- Retracement
- Aroon
INDICATORS LIST
LIST OF TOPICS
PRINT THIS ARTICLE
by Alan R. Northam
Statistical analysis shows the high-risk market sector turning lower.
Position: N/A
Alan R. Northam
Alan Northam lives in the Dallas, Texas area and as an electronic engineer gave him an analytical mind from which he has developed a thorough knowledge of stock market technical analysis. His abilities to analyze the future direction of the stock market has allowed him to successfully trade of his own portfolio over the last 30 years. Mr. Northam is now retired and trading the stock market full time. You can reach him at inquiry@tradersclassroom.com or by visiting his website at http://www.tradersclassroom.com. You can also follow him on Twitter @TradersClassrm.
PRINT THIS ARTICLE
LIN. REGTREND
Microcaps Turning Down?
02/01/11 08:41:14 AMby Alan R. Northam
Statistical analysis shows the high-risk market sector turning lower.
Position: N/A
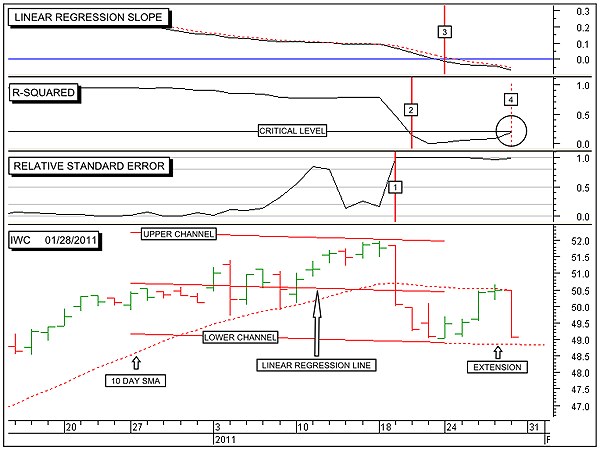
| The microcapitalization market sector is one of the highest risk sectors to trade. When it is moving upward, it shows that traders are comfortable about the overall stock market and are willing to accept higher-risk trades with the hopes of higher profits. However, when this market is moving lower, it shows that traders are extremely worried about the stock market and are no longer willing to accept this level of high risk. This analysis shows a high probability that the microcap market sector has already started to turn lower. Figure 1 shows the short-term picture of the iShares Russell MicroCap exchange traded fund (IWC). The bottom window of Figure 1 shows the daily trading bars along with the 20-day linear regression line and its upper and lower channel lines. The proper way to draw the 20-day linear regression line is to draw it to the most recent low, in the case of a downtrend, and and then extend it forward as I have shown in Figure 1. In Figure 1 I have only extended the lower channel line forward since I am interested in a possible breakdown of this line. This window shows that the short-term trend has turned lower, but the trend remains extremely shallow. A breakdown of the extended lower channel line will signal an increase in the steepness of the downtrend as measured by the linear regression line and that the short-term trend is moving lower. |
|
| FIGURE 1: IWC, DAILY. This chart shows the daily price chart of iShares Russell MicroCap exchange traded fund in the bottom window along with the 20-day linear regression line and its upper and lower channel lines, the linear regression slope indicator in the top window, the R-squared indicator in the second window, and the relative standard error indicator in the third. |
| Graphic provided by: MetaStock. |
| |
| The first step toward a trend reversal is that there is normally a rapid increase in volatility that reaches a high condition or state. The relative standard error indicator shows this phenomenon. I have marked this with a red vertical line labeled no. 1. This is an indicator I developed to quantify the normal standard error indicator. This indicator can move between zero and 1 with 1 representing extremely high volatility and zero representing no volatility. When this indicator is above 0.8, it indicates high volatility. When it is between 0.8 and 0.5, it indicates above-average volatility. Below 0.5 and above 0.2, it indicates below-average volatility, and below 0.2, low volatility. Currently, volatility is at an extremely high level warning of a possible reversal in trend ahead. |
| The second step toward a trend reversal is that the current trend loses significance. This occurs when the R-squared indicator moves below its critical level. This level is the demarcation line between a significant trend and an insignificant one. In the world of statistics when the R-squared indicator is above its critical level, it indicates a 95% probability that a significant trend is in effect. Inversely, when below the critical line, it indicates a lack of significant trend and there is no longer a high probability that the current trend will continue. Note that the R-squared indicator has moved below its critical level. I have shown the date when the R-squared indicator moved below its critical level with a red vertical line marked #2. Note that at the time the R-squared indicator moved below its critical level, the linear regression slope indicator was still above its zero line, indicating that the 20-day linear regression trendline was still in a short-term uptrend. When the R-squared indicator moved below its critical level, it signaled that the uptrend lost significance. |
| The third step toward a trend reversal is the reversal of the trend itself. A trend reversal occurs when the slope of the 20-day linear regression trendline moves from an upward direction to a downward one. The linear regression slope indicator shows when this transition occurs. A reversal in trend occurs when the linear regression slope indicator passes through its zero line. I have shown when the trend of IWC transitioned from an uptrend to a downtrend with a red vertical line marked #3. This indicator now shows that the microcapitalization market sector is in a downtrend. As long as this indicator continues to move in a downward direction, it indicates that the downsloping linear regression trendline will continue to steepen. In the traditional technical analysis terminology, this indicates downward price acceleration. The fourth step toward a trend reversal occurs when the newly established reversal in trend becomes significant. A significant trend is established when the R-squared indicator moves above its critical level. Note that as of today the R-squared indicator remains below its critical level, indicating that the newly established downtrend remains weak. During such times, the trend is vulnerable to reverse back to the previous trend, which would be upward in our case. Another way of stating this is that weak trends represent corrections within an ongoing trend. The chart shows, however, that the R-squared indicator continues to point upward and is thus on the verge of crossing the critical line and becoming a significant trend. I have shown this condition by the red dotted vertical line marked #4 on the chart. A crossing of the critical line will signal that a significant downtrend has been established. The fifth and final step toward a trend reversal occurs when the relative standard error indicator moves back below 0.5 to indicate below average volatility. Below average to low volatility is an indication that the newly established trend will continue. |
| In conclusion, statistical analysis of the iShares Russell MicroCap ETF (IWC) is in step #3 of a five-step process reversing the short-term trend from up to down. If steps 4 and 5 are not completed, the down turn from mid-January is corrective. However, should the R-squared indicator move above its critical line, it will indicate that a strong short-term downtrend has been established. In addition, should the relative standard error indicator move below 0.5, it will indicate that the strong short-term downtrend will continue for some time. For now, the move down from mid-January signals a market correction with an increasing probability that a new significant short-term downtrend is about to be developed. |
Alan Northam lives in the Dallas, Texas area and as an electronic engineer gave him an analytical mind from which he has developed a thorough knowledge of stock market technical analysis. His abilities to analyze the future direction of the stock market has allowed him to successfully trade of his own portfolio over the last 30 years. Mr. Northam is now retired and trading the stock market full time. You can reach him at inquiry@tradersclassroom.com or by visiting his website at http://www.tradersclassroom.com. You can also follow him on Twitter @TradersClassrm.
| Garland, Tx | |
| Website: | www.tradersclassroom.com |
| E-mail address: | inquiry@tradersclassroom.com |
Click here for more information about our publications!
PRINT THIS ARTICLE

Request Information From Our Sponsors
- StockCharts.com, Inc.
- Candle Patterns
- Candlestick Charting Explained
- Intermarket Technical Analysis
- John Murphy on Chart Analysis
- John Murphy's Chart Pattern Recognition
- John Murphy's Market Message
- MurphyExplainsMarketAnalysis-Intermarket Analysis
- MurphyExplainsMarketAnalysis-Visual Analysis
- StockCharts.com
- Technical Analysis of the Financial Markets
- The Visual Investor
- VectorVest, Inc.
- Executive Premier Workshop
- One-Day Options Course
- OptionsPro
- Retirement Income Workshop
- Sure-Fire Trading Systems (VectorVest, Inc.)
- Trading as a Business Workshop
- VectorVest 7 EOD
- VectorVest 7 RealTime/IntraDay
- VectorVest AutoTester
- VectorVest Educational Services
- VectorVest OnLine
- VectorVest Options Analyzer
- VectorVest ProGraphics v6.0
- VectorVest ProTrader 7
- VectorVest RealTime Derby Tool
- VectorVest Simulator
- VectorVest Variator
- VectorVest Watchdog