HOT TOPICS LIST
- MACD
- Fibonacci
- RSI
- Gann
- ADXR
- Stochastics
- Volume
- Triangles
- Futures
- Cycles
- Volatility
- ZIGZAG
- MESA
- Retracement
- Aroon
INDICATORS LIST
LIST OF TOPICS
PRINT THIS ARTICLE
by Koos van der Merwe
We knew that a correction was in the offing. The question was when.
Position: Sell
Koos van der Merwe
Has been a technical analyst since 1969, and has worked as a futures and options trader with First Financial Futures in Johannesburg, South Africa.
PRINT THIS ARTICLE
OSCILLATORS
Is This The Correction?
02/02/11 07:52:06 AMby Koos van der Merwe
We knew that a correction was in the offing. The question was when.
Position: Sell
| We knew a correction was due for the world stock markets. Would anyone have believed a few weeks ago that the correction would be triggered by the Internet? Someone did, as shown by the Dow Average Transportation Index, which started falling a week before the Dow Jones Industrial Average (DJIA) and the S&P indexes. |

|
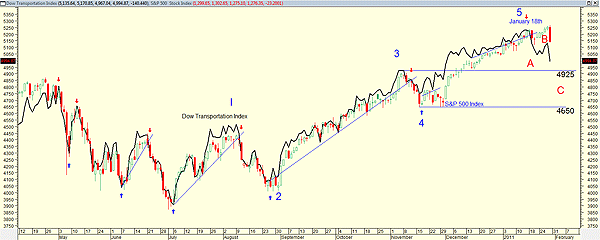
| FIGURE 1: S&P 500 AND DJTA |
| Graphic provided by: MetaStock. |
| |
| Figure 1 is a daily chart showing the Standard & Poor's 500 and the Dow Jones Transportation Index (DJTA). Note how in the past the DJTA gave buy and sell signals that tied in closely with the S&P 500. However, on January 18, the DJTA gave a sell signal when it broke down through its short-term trendline. The short-term Elliott wave count shows that a wave 5 has been completed, and that the DJTA has fallen in an ABC correction. However, the correction is not complete because it should fall to the fourth wave of lesser degree -- that is, somewhere between 4650 and 4925. This ABC correction is not reflected in the DJIA at the moment, suggesting that the ABC correction could well be an abc correction in a A-wave down. Time will tell. Remember, an Elliott wave count is simply a signpost on a road, with another signpost a little way down the road. Reading those signposts as they appear, and changing one's viewpoint, is important. |

|
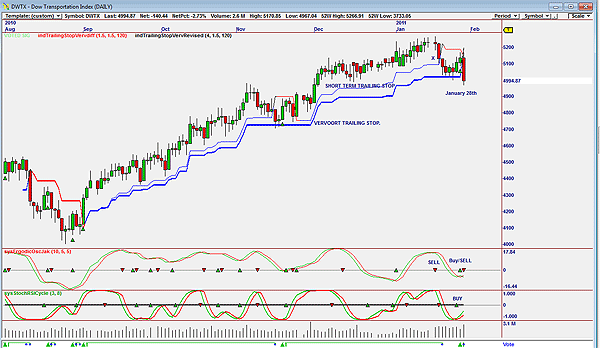
| FIGURE 2: DJTA |
| Graphic provided by: OmniTrader. |
| |
| Figure 2 shows the DJTA gave an early warning sell signal at X by breaking below the short-term Vervoort trailing stop. The DJTA then found support on the Vervoort trailing stop (3%) before falling through it and giving a sell signal on January 28. The ergodic oscillator and the stochastic RSI cycle oscillator are both suggesting buy signals, as is the vote line. The vote line, however, immediately triggered a stop signal, as the index fell on January 28. This fall was accompanied by volume greater than average, which does signal weakness. Uncertainty always feeds doubt. What happens over the week ahead is very important, as to the depth of the fall and the time before the market starts recovering. |
Has been a technical analyst since 1969, and has worked as a futures and options trader with First Financial Futures in Johannesburg, South Africa.
| Address: | 3256 West 24th Ave |
| Vancouver, BC | |
| Phone # for sales: | 6042634214 |
| E-mail address: | petroosp@gmail.com |
Click here for more information about our publications!
PRINT THIS ARTICLE

Request Information From Our Sponsors
- StockCharts.com, Inc.
- Candle Patterns
- Candlestick Charting Explained
- Intermarket Technical Analysis
- John Murphy on Chart Analysis
- John Murphy's Chart Pattern Recognition
- John Murphy's Market Message
- MurphyExplainsMarketAnalysis-Intermarket Analysis
- MurphyExplainsMarketAnalysis-Visual Analysis
- StockCharts.com
- Technical Analysis of the Financial Markets
- The Visual Investor
- VectorVest, Inc.
- Executive Premier Workshop
- One-Day Options Course
- OptionsPro
- Retirement Income Workshop
- Sure-Fire Trading Systems (VectorVest, Inc.)
- Trading as a Business Workshop
- VectorVest 7 EOD
- VectorVest 7 RealTime/IntraDay
- VectorVest AutoTester
- VectorVest Educational Services
- VectorVest OnLine
- VectorVest Options Analyzer
- VectorVest ProGraphics v6.0
- VectorVest ProTrader 7
- VectorVest RealTime Derby Tool
- VectorVest Simulator
- VectorVest Variator
- VectorVest Watchdog
