HOT TOPICS LIST
- MACD
- Fibonacci
- RSI
- Gann
- ADXR
- Stochastics
- Volume
- Triangles
- Futures
- Cycles
- Volatility
- ZIGZAG
- MESA
- Retracement
- Aroon
INDICATORS LIST
LIST OF TOPICS
PRINT THIS ARTICLE
by Koos van der Merwe
Microsoft reports good numbers. The share price rises, but then drops. Why?
Position: Sell
Koos van der Merwe
Has been a technical analyst since 1969, and has worked as a futures and options trader with First Financial Futures in Johannesburg, South Africa.
PRINT THIS ARTICLE
TREND-CHANNEL
What's Wrong With Microsoft?
01/28/11 11:42:51 AMby Koos van der Merwe
Microsoft reports good numbers. The share price rises, but then drops. Why?
Position: Sell
| Microsoft's earnings were due out at close of market on January 27, but someone let the earnings out of the bag early. Fiscal second-quarter revenue came in at $19.95 billion, yielding earnings per share of $0.77, beating the consensus $19.14 billion and $0.68. For the fiscal year, Microsoft reaffirmed a forecast of $26.9 billion to $27.3 billion in operating expenses. With 10 minutes still to trade before the market closed, Microsoft (MSFT) shares spiked rising $0.39, or 1.5%, to $29.17 and then promptly fell to close at $28.87. Why? The company is sound with outstanding products like Microsoft Office, which is a steady income earner. What's missing? Simple... they are missing a Steve Jobs -- a man at the head of Apple Inc. (AAPL), the company that has an imagination that is almost Disney (which he is on the board of directors of). Steve Ballmer may be a highly efficient president of Microsoft, but he is staid. Instead of being a leader, he has become a follower. Today, exactly a year ago, Steve Jobs unveiled the iPad tablet, a product that has changed the computer market. A year later, Microsoft has not offered a program or a product that effectively challenges the iPad. |

|
| FIGURE 1: MSFT, MONTHLY |
| Graphic provided by: AdvancedGET. |
| |
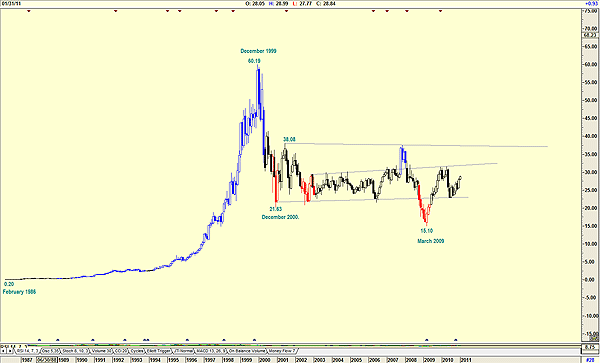
| Figure 1 is a monthly chart of MSFT from February 1986. After all the splits MSFT has had, the price at that date works out at $0.20. The share price then rose to a high of $60.19 by December 1999 and then fell to $21.63 by December 2000. The chart shows how the share price has traded in the range of $21.63 to $38.08 since then, with a drop to $15.10 in March 2009, and a rapid recovery back to its trading range. |

|
| FIGURE 2: MSFT, DAILY |
| Graphic provided by: AdvancedGET. |
| |
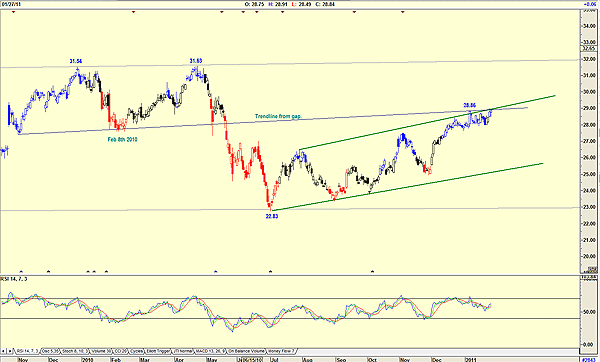
| Figure 2, a daily chart, shows how the MSFT share price went from $31.54 to $31.63. It then fell to $22.83, its long-term monthly support line at $22.83 before recovering to $28.86. The relative strength index (RSI) is at overbought levels and falling. The trendline drawn from the GAP to the low of February 8, 2010, is suggesting that at current levels, the share price has peaked. Hewlett Packard bought Compaq, and a few years later, Palm for its brains and ingenuity. Microsoft has bought nothing, relying on itself. Admittedly, a rise from $22 to $28 is not to be sneezed at, but it is nowhere near the rise from $240 to $320 shown by AAPL. My advice to Microsoft? Look for a Steve Jobs and when you have found him or her, BUY. |
Has been a technical analyst since 1969, and has worked as a futures and options trader with First Financial Futures in Johannesburg, South Africa.
| Address: | 3256 West 24th Ave |
| Vancouver, BC | |
| Phone # for sales: | 6042634214 |
| E-mail address: | petroosp@gmail.com |
Click here for more information about our publications!
PRINT THIS ARTICLE

Request Information From Our Sponsors
- StockCharts.com, Inc.
- Candle Patterns
- Candlestick Charting Explained
- Intermarket Technical Analysis
- John Murphy on Chart Analysis
- John Murphy's Chart Pattern Recognition
- John Murphy's Market Message
- MurphyExplainsMarketAnalysis-Intermarket Analysis
- MurphyExplainsMarketAnalysis-Visual Analysis
- StockCharts.com
- Technical Analysis of the Financial Markets
- The Visual Investor
- VectorVest, Inc.
- Executive Premier Workshop
- One-Day Options Course
- OptionsPro
- Retirement Income Workshop
- Sure-Fire Trading Systems (VectorVest, Inc.)
- Trading as a Business Workshop
- VectorVest 7 EOD
- VectorVest 7 RealTime/IntraDay
- VectorVest AutoTester
- VectorVest Educational Services
- VectorVest OnLine
- VectorVest Options Analyzer
- VectorVest ProGraphics v6.0
- VectorVest ProTrader 7
- VectorVest RealTime Derby Tool
- VectorVest Simulator
- VectorVest Variator
- VectorVest Watchdog
