

HOT TOPICS LIST
- MACD
- Fibonacci
- RSI
- Gann
- ADXR
- Stochastics
- Volume
- Triangles
- Futures
- Cycles
- Volatility
- ZIGZAG
- MESA
- Retracement
- Aroon
INDICATORS LIST
LIST OF TOPICS
PRINT THIS ARTICLE
by Donald W. Pendergast, Jr.
Incredibly, some stocks, even after a sustained run higher, still appear to have plenty of fire beneath them, propelling them higher.
Position: N/A
Donald W. Pendergast, Jr.
Donald W. Pendergast is a financial markets consultant who offers specialized services to stock brokers and high net worth individuals who seek a better bottom line for their portfolios.
PRINT THIS ARTICLE
ACCUM./DIST. CHAIKIN
Baker Hughes Turning On The Afterburners
01/27/11 09:01:34 AMby Donald W. Pendergast, Jr.
Incredibly, some stocks, even after a sustained run higher, still appear to have plenty of fire beneath them, propelling them higher.
Position: N/A
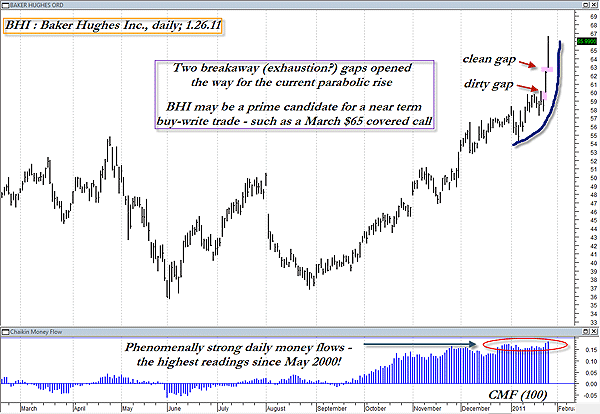
| The entire energy services industry group has been strong for many months now, so it's no surprise to see such a big-name stock within the group beginning to go parabolic. Normally, such parabolic rises near the end of an extended bull run are an early warning that the trend is nearing a point of final exhaustion. Timing that point of reversal is the real trick, of course, and that's where the top pickers of the world tend to get into real financial hot water every so often. As you've probably noticed, many of my articles over the past three weeks have focused on stocks that have begun to go into vertical ascent mode, so I can't be said to be unbiased in my belief that the broad US stock indexes are overdue for at least a 10% correction -- one that could begin at a moment's notice. Nevertheless, as serious technicians, we still have to learn to put our personal beliefs aside and instead place our focus on the cold hard data on the price charts and on other objective kinds of fundamental data that affect the markets we follow. Right now, shares of Baker Hughes (BHI) actually look as if there is little to hold back a further rise -- a final thrust higher into its ultimate parabolic blow-off top, that is. See Figure 1. |
|
| FIGURE 1: BHI, DAILY. Many professional traders are leery of trying to play a stock that's in parabolic ascent mode, but since this energy services stock also has incredibly strong money flow characteristics, smart traders and conservative investors might want to just go with a near-term covered-call trade, rather than a straight stock position. |
| Graphic provided by: MetaStock. |
| |
| Yes, the stock is up by more than 81% in only five months, and it's also starting to go into parabolic rise mode. But if you have a sharp eye, you'll also see that the long-term money flow (the 100-day Chaikin money flow indicator at the bottom of the chart [CMF][100]) now is at its absolute highest reading in nearly 11 years! Apparently, the institutional money has a great fondness for shares of this particular oil service industry behemoth, and they're plowing enormous sums of cash into further acquisition of the stock. And with money flow and trend characteristics so impossibly strong in BHI now, this stock is a near-perfect candidate for covered call writing. See Figure 2. |
|
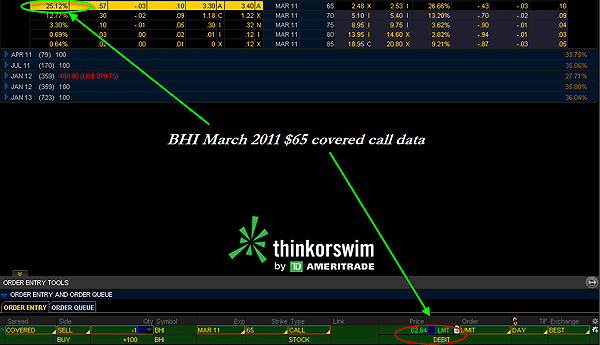
| FIGURE 2: BHI COVERED CALL. A 25% annualized rate of return looks very appealing, particularly if the risk/reward scenario of such a covered-call play can be wisely managed. |
| Graphic provided by: Thinkorswim. |
| |
| As of Wednesday, January 26's close, a March $65 BHI covered call was selling for about $62.64 (before commissions), meaning that if the shares are called away at options expiration, the annualized return of such a seven-week commitment of trading capital would be about 25%. Not too shabby in a world of Great Recession, 1% bank CD rates, right? Of course, this isn't a risk-free deal like putting your money into an FDIC-insured bank, so you'll still need to have a logical and emotion-free way to close out the trade early, just in case it doesn't work out as planned. In this case, the daily chart has already been gracious enough to provide you with an appropriate stop-loss point, which in this case happens to be the lower boundary of the recent clean breakaway gap (top, pink-shaded area). That equates to a price of $62.50, so if you see BHI do a sharp reversal move lower, one that closes below $62.50, just close out the trade and wait for another opportunity elsewhere. If the stock is truly embarking on a move to higher highs, it is unlikely that the recent gaps would be filled so quickly, so if the stock did happen to suddenly drop and fill the gaps, you'd know that the stock was likely signaling that the uptrend was over and a correction was under way. In such a case, there would be no reason to hold onto the covered call, and the only rational choice would be to quickly liquidate it. See Figure 3. |
|
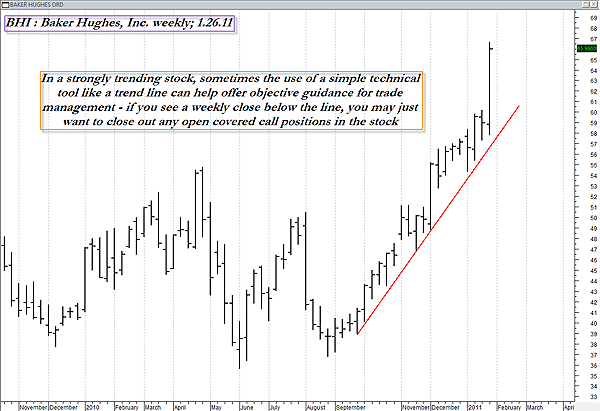
| FIGURE 3: BHI, WEEKLY. It ain't high tech, but it sure gets the job done. Yes, it's just a plain old trendline, one drawn on BHI's weekly chart. This simple technical tool can often provide covered-call traders with an objective means to determine whether to hold a buy-write trade until expiration -- or to close it out early, minimizing losses. |
| Graphic provided by: MetaStock. |
| |
| If BHI just happens to keep motoring higher, however, then your job of trade management becomes relatively stress-free; consider running a simple trendline on the BHI weekly chart, one that starts on the September 24 weekly bar's lows and then stretch it higher, connecting the November 19 and December 3 weekly lows as well. The resulting uptrend line will help give you an objective, no-nonsense way to help manage the open trade, assuming the previously mentioned gaps aren't quickly filled. It's only one of many ways that you can use to manage a covered-call position, but this one is nice because it tends to give the stock some back-and-fill room on the daily chart while helping keep you on the right side of the dominant weekly trend in the stock. Try using similar methods on the stocks you follow and see if it doesn't help you make better trading and investing decisions. |
Donald W. Pendergast is a financial markets consultant who offers specialized services to stock brokers and high net worth individuals who seek a better bottom line for their portfolios.
| Title: | Writer, market consultant |
| Company: | Linear Trading Systems LLC |
| Jacksonville, FL 32217 | |
| Phone # for sales: | 904-239-9564 |
| E-mail address: | lineartradingsys@gmail.com |
Traders' Resource Links | |
| Linear Trading Systems LLC has not added any product or service information to TRADERS' RESOURCE. | |
Click here for more information about our publications!
PRINT THIS ARTICLE

Request Information From Our Sponsors
- StockCharts.com, Inc.
- Candle Patterns
- Candlestick Charting Explained
- Intermarket Technical Analysis
- John Murphy on Chart Analysis
- John Murphy's Chart Pattern Recognition
- John Murphy's Market Message
- MurphyExplainsMarketAnalysis-Intermarket Analysis
- MurphyExplainsMarketAnalysis-Visual Analysis
- StockCharts.com
- Technical Analysis of the Financial Markets
- The Visual Investor
- VectorVest, Inc.
- Executive Premier Workshop
- One-Day Options Course
- OptionsPro
- Retirement Income Workshop
- Sure-Fire Trading Systems (VectorVest, Inc.)
- Trading as a Business Workshop
- VectorVest 7 EOD
- VectorVest 7 RealTime/IntraDay
- VectorVest AutoTester
- VectorVest Educational Services
- VectorVest OnLine
- VectorVest Options Analyzer
- VectorVest ProGraphics v6.0
- VectorVest ProTrader 7
- VectorVest RealTime Derby Tool
- VectorVest Simulator
- VectorVest Variator
- VectorVest Watchdog