HOT TOPICS LIST
- MACD
- Fibonacci
- RSI
- Gann
- ADXR
- Stochastics
- Volume
- Triangles
- Futures
- Cycles
- Volatility
- ZIGZAG
- MESA
- Retracement
- Aroon
INDICATORS LIST
LIST OF TOPICS
PRINT THIS ARTICLE
by Donald W. Pendergast, Jr.
Of all the major US stock indexes, only the mighty Dow 30 is still making fresh post-crash highs, with IBM being the main mover within its ranks.
Position: N/A
Donald W. Pendergast, Jr.
Donald W. Pendergast is a financial markets consultant who offers specialized services to stock brokers and high net worth individuals who seek a better bottom line for their portfolios.
PRINT THIS ARTICLE
BREAKAWAY GAP
IBM Moving The Dow 30 Ever Higher
01/26/11 08:40:04 AMby Donald W. Pendergast, Jr.
Of all the major US stock indexes, only the mighty Dow 30 is still making fresh post-crash highs, with IBM being the main mover within its ranks.
Position: N/A
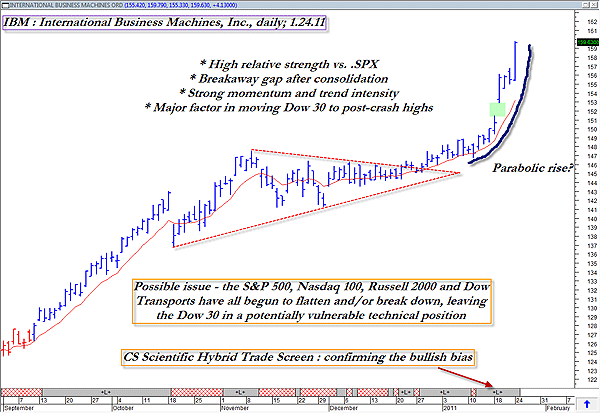
| Somehow, the Dow Jones Industrial Average (DJIA) manages to keep on chugging higher, even though many of its peer indexes are already beginning to fall by the wayside. IBM is the prime mover in the DJIA right now, and is still looking very strong. Figure 1 is a brief look at IBM's very interesting daily chart. |

|
| FIGURE 1: IBM, DAILY. As most other major stock indexes start to stumble, only the Dow 30 index continues to make new post-crash highs. This daily chart of IBM looks very healthy, but traders need to be very aware of the potential for a sharp reversal if the DJIA decides to correct along with all the other indexes soon. |
| Graphic provided by: MetaStock. |
| Graphic provided by: MetaStock v.11 CS Scientific expert advisor. |
| |
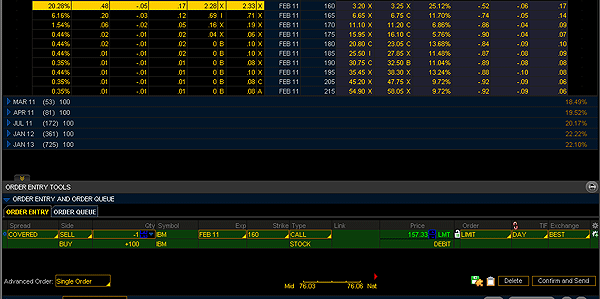
| Without waxing too eloquent here, let's just say that this daily chart of IBM appears to be in tip-top technical health, and that under normal market conditions would also seem to make IBM a near-perfect candidate for a near-term covered call trade. The stock made a powerful breakout from a nice consolidation pattern -- and with a large breakaway gap to boot. As measured by one of the more powerful MetaStock expert advisors (the CS Scientific Hybrid Trade Screen; see the gray and red ribbons at the base of the chart), the stock also gets high marks for having strong momentum and trend intensity characteristics, too. So what's not to like about going long shares of IBM at these lofty price levels? Generally speaking, not much, particularly from a short-term covered-call standpoint. In fact, you can buy a February IBM $160 covered call for about $157.33, and if the stock is called away at option expiration, you can expect to earn about a 20% annualized rate of return in less than four weeks. This is an at-the-money (ATM) covered call (CC), so it won't provide as much protection against whipsaws as an in-the-money (ITM) CC setup. As such, you'd need to act more quickly to close out a trade that was starting to move sharply against you. Many times, a 21-period moving average and/or a significant uptrend line can serve as a reasonably effective stop-loss and/or trailing stop for CC trades, which generally benefit from a larger stop than a typical short-term swing trade. Regardless, at least we have a nice-looking long CC setup available in shares of IBM. But is this really the best time to deploy such a strategy in the equities market? Maybe. Then again, maybe not. See Figure 2. |

|
| FIGURE 2: IBM COVERED CALL. A February IBM $142 covered call will generate close to 20% in annualized returns if the stock is called away at option expiration. |
| Graphic provided by: Thinkorswim. |
| |
| While it's foolish to argue with such a potentially bullish trade setup, a wise trader will also want to look at the big picture, including the current technical state of the major US stock indexes, and that's where the alarm bells start ringing. With the Standard & Poor's 500, NASDAQ 100, Russell 2000, and Dow transport indexes all starting to flatten out and/or reverse lower, the technical imagery on our daily IBM chart suddenly doesn't look quite as safe, and, in fact, almost could be viewed as gigantic red flag -- one that says "Tread lightly" or "Fools rush in." Sooner or later, either the Dow 30's peer stock indexes start to perk up and join it on the road to higher post-crash highs or the Dow 30 flares out, turns lower, and joins the other stock indexes on the pathway toward major support levels. |
| For real adventure seekers, perhaps putting on a covered-call trade like this might make sense, but if you're the more conservative type, it's probably better to sit on the sidelines for a week or two until this divergence among the major US stock indexes begins to resolve itself. While common sense dictates that the markets are more likely to correct soon rather than to move quickly to even higher highs, the fact is that absolutely no one knows exactly what the market is going to do tomorrow, next week, or even next year. And this is one of those times when the old traders' wisdom of "When in doubt, stay out" really does seem to apply. |
Donald W. Pendergast is a financial markets consultant who offers specialized services to stock brokers and high net worth individuals who seek a better bottom line for their portfolios.
| Title: | Writer, market consultant |
| Company: | Linear Trading Systems LLC |
| Jacksonville, FL 32217 | |
| Phone # for sales: | 904-239-9564 |
| E-mail address: | lineartradingsys@gmail.com |
Traders' Resource Links | |
| Linear Trading Systems LLC has not added any product or service information to TRADERS' RESOURCE. | |
Click here for more information about our publications!
PRINT THIS ARTICLE

Request Information From Our Sponsors
- StockCharts.com, Inc.
- Candle Patterns
- Candlestick Charting Explained
- Intermarket Technical Analysis
- John Murphy on Chart Analysis
- John Murphy's Chart Pattern Recognition
- John Murphy's Market Message
- MurphyExplainsMarketAnalysis-Intermarket Analysis
- MurphyExplainsMarketAnalysis-Visual Analysis
- StockCharts.com
- Technical Analysis of the Financial Markets
- The Visual Investor
- VectorVest, Inc.
- Executive Premier Workshop
- One-Day Options Course
- OptionsPro
- Retirement Income Workshop
- Sure-Fire Trading Systems (VectorVest, Inc.)
- Trading as a Business Workshop
- VectorVest 7 EOD
- VectorVest 7 RealTime/IntraDay
- VectorVest AutoTester
- VectorVest Educational Services
- VectorVest OnLine
- VectorVest Options Analyzer
- VectorVest ProGraphics v6.0
- VectorVest ProTrader 7
- VectorVest RealTime Derby Tool
- VectorVest Simulator
- VectorVest Variator
- VectorVest Watchdog
