HOT TOPICS LIST
- MACD
- Fibonacci
- RSI
- Gann
- ADXR
- Stochastics
- Volume
- Triangles
- Futures
- Cycles
- Volatility
- ZIGZAG
- MESA
- Retracement
- Aroon
INDICATORS LIST
LIST OF TOPICS
PRINT THIS ARTICLE
by Mike Carr, CMT
As the bear market unfolded in 2008, interest rates on the 10-year Treasury note fell by about 50% in a little more than six months. A 40% decline in interest rates in 2010 looks similar, despite the different economic factors and vastly different economic environments.
Position: N/A
Mike Carr, CMT
Mike Carr, CMT, is a member of the Market Technicians Association, and editor of the MTA's newsletter, Technically Speaking. He is also the author of "Smarter Investing in Any Economy: The Definitive Guide to Relative Strength Investing," and "Conquering the Divide: How to Use Economic Indicators to Catch Stock Market Trends."
PRINT THIS ARTICLE
CHART ANALYSIS
Market Symmetry In Interest Rates?
01/25/11 08:17:36 AMby Mike Carr, CMT
As the bear market unfolded in 2008, interest rates on the 10-year Treasury note fell by about 50% in a little more than six months. A 40% decline in interest rates in 2010 looks similar, despite the different economic factors and vastly different economic environments.
Position: N/A
| History never repeats itself exactly, but at times it can present startling analogues. Some market analysts look for analogues in price action, which are thought of as periods of time where the charts resemble each other. Many have compared the 1999 top in the stock market to the 1929 top and lined up charts to show how closely they track. The truth is that the analogues often do repeat, for a time, but eventually the seemingly close relationship breaks down. There's no logical reason that analogues should work, so the fact that they don't work 100% of the time shouldn't be a surprise. |
| Even though they shouldn't form the basis for trading decisions, it is still interesting to look at these phenomena in charts. Charlatans can use the charts to claim they know what the future holds, prudent traders can think of it as mildly interesting, or perhaps can even learn valuable lessons from the charts. |
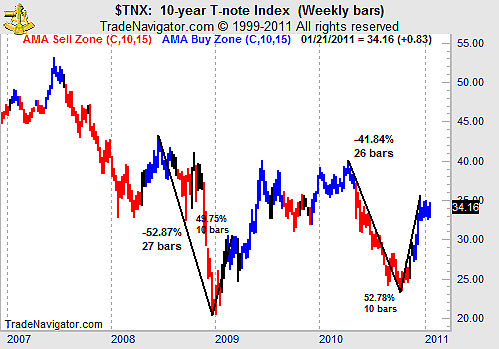
| Interest rates offer an example of an analogue. Figure 1 shows the 10-year Treasury rate and we can see two recent sharp declines, one that lasted 27 weeks and one which lasted 26 weeks. Both saw 10-week recoveries that retraced nearly half the decline and pushed rates higher. That's where we are now and if history repeats, a consolidation in rates would take place (as it is) and higher rates would follow. Of course, this chart doesn't present a valid reason to take a trade expecting to profit from higher rates. |

|
| FIGURE 1: $TNX, WEEKLY. Weekly interest rates slow an interesting but untradable analogue. |
| Graphic provided by: Trade Navigator. |
| |
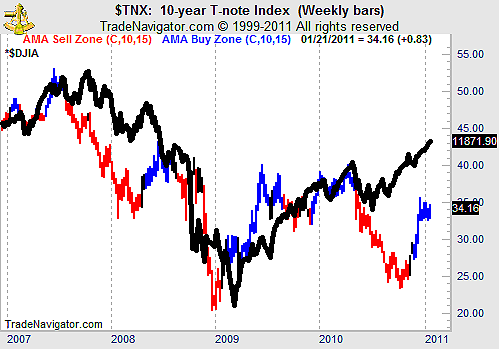
| More important than expecting the future to repeat the past, we can learn that interest rates and stock prices don't actually have a very close relationship. Many believe that lower rates make stocks more attractive, but stocks fell with rates in 2008 and seem to have been largely unaffected by the more recent moves in interest rates (Figure 2). Those seeking to exploit this well-known intermarket relationship would have had a difficult time profiting. |

|
| FIGURE 2: $TNX, VS. DJIA. Interest rates and stock prices (the black line is the Dow Jones Industrial Average) seem to have a random relationship with each other, at least over the short term. |
| Graphic provided by: Trade Navigator. |
| |
| We may see interest rates consolidate and eventually move higher. But if they do, it has nothing to do with the belief that markets form symmetrical patterns on charts. We also see that intermarket relationships only work sometimes, and trading really should be based upon a preponderance of the evidence approach, relying on multiple inputs. |
Mike Carr, CMT, is a member of the Market Technicians Association, and editor of the MTA's newsletter, Technically Speaking. He is also the author of "Smarter Investing in Any Economy: The Definitive Guide to Relative Strength Investing," and "Conquering the Divide: How to Use Economic Indicators to Catch Stock Market Trends."
| Website: | www.moneynews.com/blogs/MichaelCarr/id-73 |
| E-mail address: | marketstrategist@gmail.com |
Click here for more information about our publications!
Comments
Date: 02/01/11Rank: 5Comment:

Request Information From Our Sponsors
- VectorVest, Inc.
- Executive Premier Workshop
- One-Day Options Course
- OptionsPro
- Retirement Income Workshop
- Sure-Fire Trading Systems (VectorVest, Inc.)
- Trading as a Business Workshop
- VectorVest 7 EOD
- VectorVest 7 RealTime/IntraDay
- VectorVest AutoTester
- VectorVest Educational Services
- VectorVest OnLine
- VectorVest Options Analyzer
- VectorVest ProGraphics v6.0
- VectorVest ProTrader 7
- VectorVest RealTime Derby Tool
- VectorVest Simulator
- VectorVest Variator
- VectorVest Watchdog
- StockCharts.com, Inc.
- Candle Patterns
- Candlestick Charting Explained
- Intermarket Technical Analysis
- John Murphy on Chart Analysis
- John Murphy's Chart Pattern Recognition
- John Murphy's Market Message
- MurphyExplainsMarketAnalysis-Intermarket Analysis
- MurphyExplainsMarketAnalysis-Visual Analysis
- StockCharts.com
- Technical Analysis of the Financial Markets
- The Visual Investor
