

HOT TOPICS LIST
- MACD
- Fibonacci
- RSI
- Gann
- ADXR
- Stochastics
- Volume
- Triangles
- Futures
- Cycles
- Volatility
- ZIGZAG
- MESA
- Retracement
- Aroon
INDICATORS LIST
LIST OF TOPICS
PRINT THIS ARTICLE
by Ron Walker
The VIX is known as the fear gauge and is a contrarian indicator. It is a yardstick that measures the markets expectations of near-term volatility. The recent low readings on the VIX suggests that there are too many bulls, which means that the buying power is nearly exhausted, which hints of trouble ahead for the stock market.
Position: N/A
Ron Walker
Ron Walker is an active trader and technical analyst. He operates an educational website dedicated to the study of Technical Analysis. The website offers free market analysis with daily video presentations and written commentaries. Ron is a video pioneer, being one of the first to utilize the internet producing Technical Analysis videos. His website is thechartpatterntrader.com
PRINT THIS ARTICLE
VOLATILITY
The VIX Triggers A New Sell Signal
01/25/11 10:08:28 AMby Ron Walker
The VIX is known as the fear gauge and is a contrarian indicator. It is a yardstick that measures the markets expectations of near-term volatility. The recent low readings on the VIX suggests that there are too many bulls, which means that the buying power is nearly exhausted, which hints of trouble ahead for the stock market.
Position: N/A
| Traditionally, the CBOE Volatility Index (VIX) trades within a range of 15 to 40. However, it spiked much higher during the financial crisis in 2008, when there was a rampant epidemic of fear. When the VIX plummets below 18 or falls to the 15 level, market participants become too complacent and that indicates that a market top is likely near. Conversely, history shows that when the VIX shoots up climbing above 30 or even proceeds to spike into the 40s, that market bottoms. |
| When the VIX moves to an extreme reading, it usually generates buy and sell signals, which can be used to effectively predict bullish and bearish turning points in the market. Low volatility spells trouble ahead as traders become complacent, while high volatility are with levels of capitulation. Adding Bollinger bands (BB) to the VIX daily chart can help identify points of fear and greed in the market and also trigger buy and sell signals, when the VIX isn't necessarily at extremes. But when the VIX pierces through a Bollinger band at an extreme, it usually marks a major top or bottom. A VIX close above the upper two standard deviation Bollinger band accompanied by a close below the upper band triggers a new buy signal. A VIX close below the lower BB followed by a confirming close back above the lower band activates a new sell signal. |
|
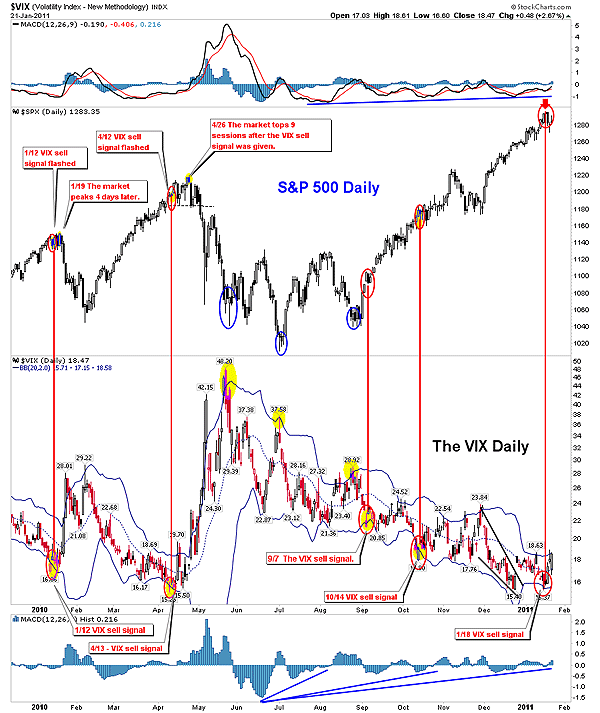
| FIGURE 1: $SPX & $VIX, DAILY. Since January 2010, the VIX has generated five sell signals. The first two signals produced significant declines in the stock, while the third and fourth signals failed. The jury is still out on the fifth signal. |
| Graphic provided by: StockCharts.com. |
| |
| Since January 2010, five sell signals have been generated on the VIX using this methodology (Figure 1). The first two that occurred in January and April 2010 proved to be timely signals, followed by sharp selloffs. The next two sell signals in September and October 2010 didn't do so well, generating false signals, which is clearly evident because the market pushed to higher levels. |
|
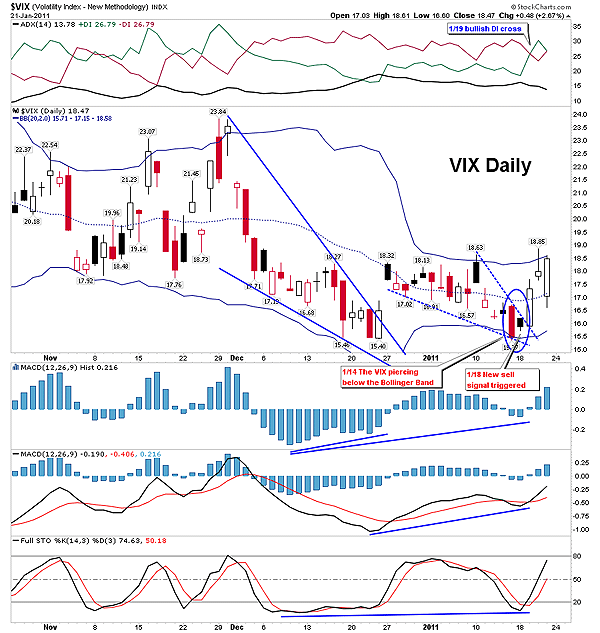
| FIGURE 2: $VIX, DAILY. After the VIX pierced through its lower Bollinger band on January 14, the VIX moved back above the lower BB, triggering a new sell signal on the stock market. |
| Graphic provided by: StockCharts.com. |
| |
| Now the VIX has triggered another sell signal (Figure 2). On Friday, January 14, the VIX fell below its lower BB, falling to close at 15.46. The following session, on January 18, the VIX generated its fifth sell signal since January 2010, by closing back above the lower BB. |
|
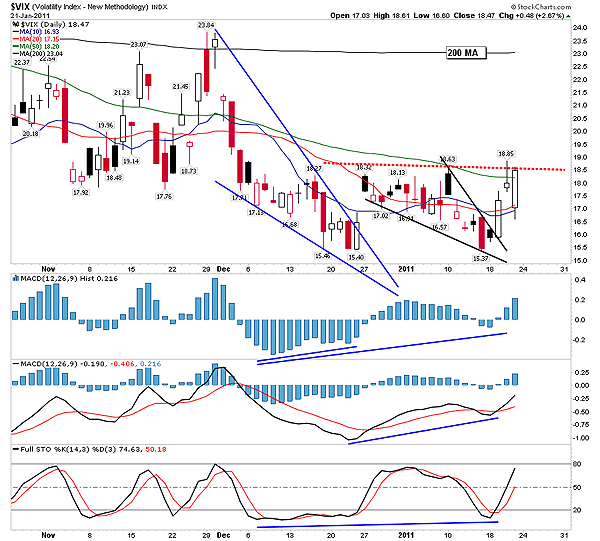
| FIGURE 3: $VIX, DAILY. Here, the VIX surged above the 10-day and 20-day MAs (blue and red lines) after forming bullish divergences and breaking out of a falling wedge pattern. After a brief pullback, the VIX rocketed to close above the 50-day MA (green line) and could be headed for the 200-day MA. Now only overhead resistance at the mid-18s stands in its way. |
| Graphic provided by: StockCharts.com. |
| |
| Not only that, but in Figure 3 we see that on January 19, the VIX got a follow-through by closing above its 10-day moving average (MA) (blue line). By the end of the week, the VIX tested the 10-day MA, successfully bouncing off of it, which resulted in the VIX catapulting to close the week above the 50-day MA (green line) and closing above 18 (Figure 3). Moreover, there is a bullish divergence on the VIX's moving average convergence/divergence (MACD) (12, 26, 9) and the MACD histogram (12, 26, 9). And the positive directional indicator (+DI) line crossed above the negative directional indicator (-DI) on January 19, the day after the new sell signal was generated on the VIX. In light of that information, the VIX sell signal may very well have produced a market top for the Standard & Poor's 500 on January 18 as it closed at 1295.02. But if it hasn't, a top usually occurs in the stock market within two weeks after a VIX sell signal has been triggered. |
Ron Walker is an active trader and technical analyst. He operates an educational website dedicated to the study of Technical Analysis. The website offers free market analysis with daily video presentations and written commentaries. Ron is a video pioneer, being one of the first to utilize the internet producing Technical Analysis videos. His website is thechartpatterntrader.com
| Website: | thechartpatterntrader.com |
| E-mail address: | thechartpatterntrader@gmail.com |
Click here for more information about our publications!
Comments

Request Information From Our Sponsors
- StockCharts.com, Inc.
- Candle Patterns
- Candlestick Charting Explained
- Intermarket Technical Analysis
- John Murphy on Chart Analysis
- John Murphy's Chart Pattern Recognition
- John Murphy's Market Message
- MurphyExplainsMarketAnalysis-Intermarket Analysis
- MurphyExplainsMarketAnalysis-Visual Analysis
- StockCharts.com
- Technical Analysis of the Financial Markets
- The Visual Investor
- VectorVest, Inc.
- Executive Premier Workshop
- One-Day Options Course
- OptionsPro
- Retirement Income Workshop
- Sure-Fire Trading Systems (VectorVest, Inc.)
- Trading as a Business Workshop
- VectorVest 7 EOD
- VectorVest 7 RealTime/IntraDay
- VectorVest AutoTester
- VectorVest Educational Services
- VectorVest OnLine
- VectorVest Options Analyzer
- VectorVest ProGraphics v6.0
- VectorVest ProTrader 7
- VectorVest RealTime Derby Tool
- VectorVest Simulator
- VectorVest Variator
- VectorVest Watchdog