HOT TOPICS LIST
- MACD
- Fibonacci
- RSI
- Gann
- ADXR
- Stochastics
- Volume
- Triangles
- Futures
- Cycles
- Volatility
- ZIGZAG
- MESA
- Retracement
- Aroon
INDICATORS LIST
LIST OF TOPICS
PRINT THIS ARTICLE
by Koos van der Merwe
Citigroup announced quarterly results on January 18, 2011, but missed its estimates.
Position: Buy
Koos van der Merwe
Has been a technical analyst since 1969, and has worked as a futures and options trader with First Financial Futures in Johannesburg, South Africa.
PRINT THIS ARTICLE
OSCILLATORS
Another Buy For Citigroup
01/24/11 02:12:36 PMby Koos van der Merwe
Citigroup announced quarterly results on January 18, 2011, but missed its estimates.
Position: Buy
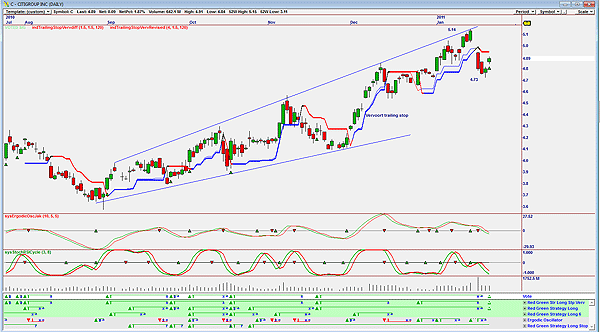
| The Thomson Reuters consensus estimated $0.08 earnings per share for the quarter. Citigroup (C) reported earnings of $0.04 per share. The share price of the company dropped on a gap from $5.14 to $4.73 on the news. Analysts at Oppenheimer (OPY) raised their price target on shares of Citigroup from $5.20 to $5.50 in a research note to investors on Wednesday, December 22. They now have an "outperform" rating on the stock. Analysts at Zacks Investment Research upgraded shares of Citigroup from a "neutral" rating to an "outperform" in a research note to investors on Monday, December 20. So would you be a buyer of Citigroup at present prices? |

|
| FIGURE 1: CITIGROUP, DAILY |
| Graphic provided by: Omnitrader. |
| |
| Figure 1 shows the following: 1. A trumpet-shaped formation developing, which is a sign of uncertainty. 2. The rise in the share price to $5.14 and the fall on a gap to $4.73. 3. A drop below the Vervoort trailing stop. 4. The ergodic oscillator indicator showing negativity. 5. The stochastic RSI indicator showing negativity. 6. Volume showed high volume on the initial sell after the quarterly results were announced, but it has stabilized whether the share price is falling or rising, confirming the uncertainty. 7. The vote line. The vote line is made up of strategies built with OmniTrader using different red green systems and different trailing stops. I have also included a strategy using the ergodic oscillator system. Using the all-strategy voting filter and the signal generation requirement, I have a lookback period of five bars with a best signal, according to Advisor Rating. I also insist on using reversing signals. The red green strategy gives a buy signal when today's close is greater than the low of six days ago. |

|
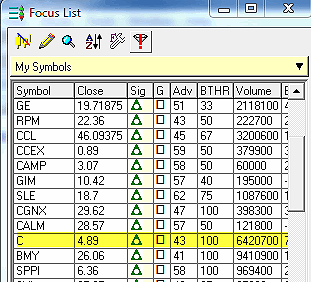
| FIGURE 2: FOCUS LIST HIGHLIGHTING CITIGROUP |
| Graphic provided by: OmniTrader. |
| |
| OmniTrader is a program originally designed for optimization on backtesting, which disturbed me. I have designed all my strategies as mechanical, not optimized, but they are backtested. On the focus list, I will only look at shares where the back test hit rate (BTHR) is 100 and the advisor rate (Adv) is 42 and greater. The BTHR and adv for Citigroup as shown on the focus list in Figure 2 is 100 and 43. As shown on the chart, Citigroup has given me a buy signal. |
Has been a technical analyst since 1969, and has worked as a futures and options trader with First Financial Futures in Johannesburg, South Africa.
| Address: | 3256 West 24th Ave |
| Vancouver, BC | |
| Phone # for sales: | 6042634214 |
| E-mail address: | petroosp@gmail.com |
Click here for more information about our publications!
Comments
Date: 01/25/11Rank: 5Comment:

Request Information From Our Sponsors
- StockCharts.com, Inc.
- Candle Patterns
- Candlestick Charting Explained
- Intermarket Technical Analysis
- John Murphy on Chart Analysis
- John Murphy's Chart Pattern Recognition
- John Murphy's Market Message
- MurphyExplainsMarketAnalysis-Intermarket Analysis
- MurphyExplainsMarketAnalysis-Visual Analysis
- StockCharts.com
- Technical Analysis of the Financial Markets
- The Visual Investor
- VectorVest, Inc.
- Executive Premier Workshop
- One-Day Options Course
- OptionsPro
- Retirement Income Workshop
- Sure-Fire Trading Systems (VectorVest, Inc.)
- Trading as a Business Workshop
- VectorVest 7 EOD
- VectorVest 7 RealTime/IntraDay
- VectorVest AutoTester
- VectorVest Educational Services
- VectorVest OnLine
- VectorVest Options Analyzer
- VectorVest ProGraphics v6.0
- VectorVest ProTrader 7
- VectorVest RealTime Derby Tool
- VectorVest Simulator
- VectorVest Variator
- VectorVest Watchdog
