

HOT TOPICS LIST
- MACD
- Fibonacci
- RSI
- Gann
- ADXR
- Stochastics
- Volume
- Triangles
- Futures
- Cycles
- Volatility
- ZIGZAG
- MESA
- Retracement
- Aroon
INDICATORS LIST
LIST OF TOPICS
PRINT THIS ARTICLE
by Alan R. Northam
Statistical analysis is an excellent method of confirming a traditional analysis of a market or security as it uses a completely different set of measurement tools, thus avoiding multicolinearity. Here I use statistical analysis to show the current long-term, intermediate-term, and short-term trends of Google.
Position: N/A
Alan R. Northam
Alan Northam lives in the Dallas, Texas area and as an electronic engineer gave him an analytical mind from which he has developed a thorough knowledge of stock market technical analysis. His abilities to analyze the future direction of the stock market has allowed him to successfully trade of his own portfolio over the last 30 years. Mr. Northam is now retired and trading the stock market full time. You can reach him at inquiry@tradersclassroom.com or by visiting his website at http://www.tradersclassroom.com. You can also follow him on Twitter @TradersClassrm.
PRINT THIS ARTICLE
LIN. REGTREND
A Statistical Look At Google
01/21/11 10:25:36 AMby Alan R. Northam
Statistical analysis is an excellent method of confirming a traditional analysis of a market or security as it uses a completely different set of measurement tools, thus avoiding multicolinearity. Here I use statistical analysis to show the current long-term, intermediate-term, and short-term trends of Google.
Position: N/A
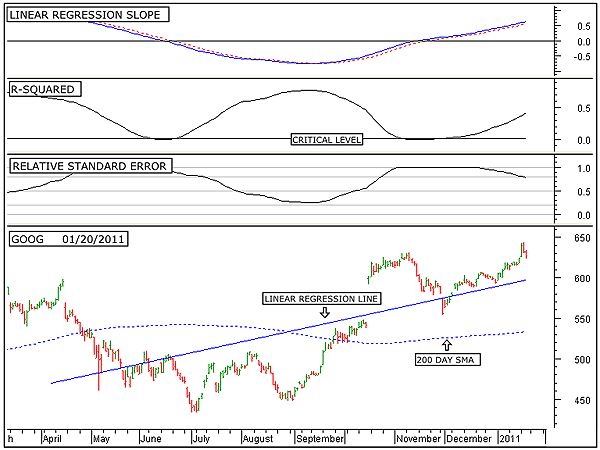
| Figure 1 shows the long-term picture of Google (GOOG) as defined by a 200-day lookback period. On the daily price chart shown in the bottom window is plotted the 200-day linear regression line. This is the trendline from a statistical point of view. Note that the linear regression line is slanting in an upward direction, indicating a long-term uptrend in play. |
|
| FIGURE 1: GOOG, DAILY. This chart shows the daily price chart of Google in the bottom window along with the 200-day linear regression line, the linear regression slope indicator in the top window, the R-squared indicator in the second window, and the relative standard error indicator in the third. |
| Graphic provided by: MetaStock. |
| |
| The linear regression slope indicator is shown in the top window. This indicator is above its zero line, which also indicates the the trend is in the upward direction. In addition, this indicator continues to move in an upward direction. This movement indicates that price is continuing to accelerate upward. The R-squared indicator is shown in the second to the top window. This indicator is an indication of the strength of the trend. When the R-squared indicator is above its critical level, it is a statistical indication that a significantly strong trend is in play and that there is a 95% probability that the uptrend will continue. The third window from the top shows the relative standard error indicator. This is an indicator that I developed to show relative volatility. When this indicator is above 0.8, it indicates high volatility. When it is between 0.8 and 0.5, it indicates above-average volatility. Below 0.5 and above 0.2, it indicates below-average volatility, and below 0.2, low volatility. Currently, volatility is starting to contract but remains above average. As long as the linear regression slope indicator and the R-squared indicator continue to move up, and as long as the relative standard error indicator continues to move down, the long-term trend will remain in the upward direction. |
|
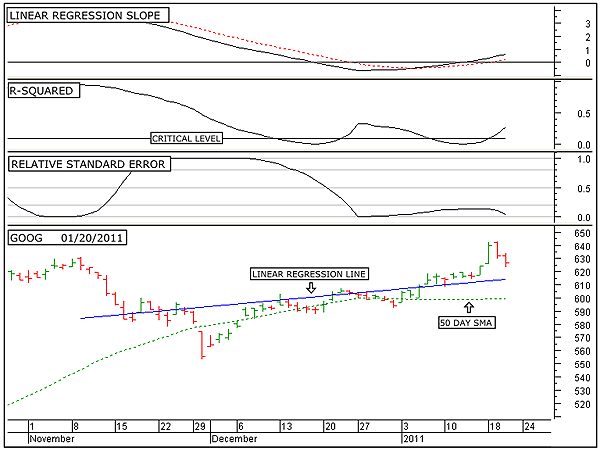
| FIGURE 2: GOOG, DAILY. This chart shows the daily price chart of Google in the bottom window along with the 50-day linear regression line, the linear regression slope indicator in the top window, the R-squared indicator in the second window, and the relative standard error indicator in the third. |
| Graphic provided by: MetaStock. |
| |
| Figure 2 shows the intermediate-term picture of Google. Note that I have also added the 50-day linear regression line over the price chart in the bottom window. This line represents the trend and shows that over the intermediate term, the trend is also in the upward direction. In addition to the linear regression line, I have also added the upper and lower linear regression channel lines. These lines are set at two standard deviations above and below the linear regression line and represent strong support and resistance levels. The top window again shows the linear regression slope over the intermediate-term time frame. Note that this indicator just moves above its zero line five days ago. This tells us that the current intermediate-term trend is just five days old. The next lower window is that of the R-squared indicator. This indicator has also recently moved above its critical level, indicating a new strong intermediate-term trend. The third window down again shows the relative standard error indicator for the intermediate-term trend. This indicator is below 0.2, indicating low volatility. The importance of volatility is that when it is high, it indicates the possibility of a trend reversal ahead, and when it is low, it indicates the possibility that there is no trend reversal ahead. However, low volatility does not preclude short-term corrections along the way. As long as the linear regression slope indicator and the R-squared indicator continues to move upward, and as long as the relative standard error indicator continues to show low volatility, Google will continue to move upward over the intermediate term. |
|
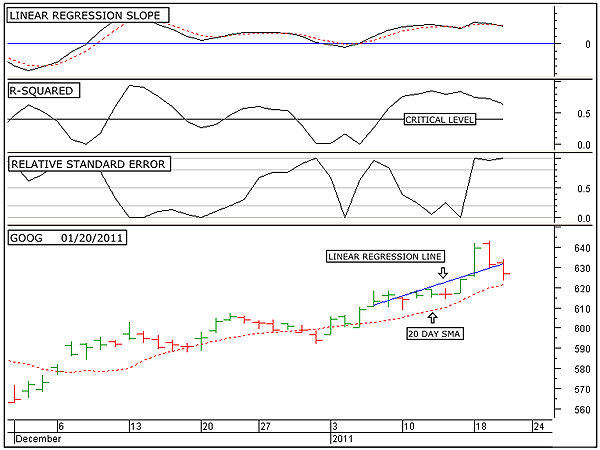
| FIGURE 3: GOOG, DAILY. This chart shows the daily price chart of Google in the bottom window along with the 10-day linear regression line, the linear regression slope indicator in the top window, the R-squared indicator in the second window, and the relative standard error indicator in the third. |
| Graphic provided by: MetaStock. |
| |
| Here's where the story of Google changes a little bit. Figure 3 shows the short-term trend of Google. On the price chart, in the bottom window I have added the 10-day linear regression line. This line shows that over the short term, the trend remains in the upward direction. In the top window I have again shown the linear regression slope indicator. Note that this indicator has now fallen below its three-day simple moving average (as shown by the red dotted line), indicating that price is starting to decelerate. Note that price deceleration normally occurs just before a trend reversal. The next lower window shows the R-squared indicator. This indicator is an indication of the strength of the trend. Note that this indicator remains above its critical level, indicating the presence of a strong short-term upward trend. However, also note that this indicator has rolled over and is pointing down. If this indicator continues in a downward direction, it will eventually move below its critical level and then signal the lack of a significant uptrend. This would then lend the short-term uptrend vulnerable to a reversal in trend. The third window down from the top shows the relative standard error indicator. This indicator shows that recently volatility has become extremely high. This extreme level of volatility is a warning of a possible change in trend ahead. Over the short term, it looks as if price is overstretched in the upward direction, with the possibility of a short-term correction ahead. |
| In conclusion, the statistical analysis of Google shows that it remains in a strong long-term and intermediate-term uptrend. However, over the short term, it appears that the market is overstretched and due for a correction. |
Alan Northam lives in the Dallas, Texas area and as an electronic engineer gave him an analytical mind from which he has developed a thorough knowledge of stock market technical analysis. His abilities to analyze the future direction of the stock market has allowed him to successfully trade of his own portfolio over the last 30 years. Mr. Northam is now retired and trading the stock market full time. You can reach him at inquiry@tradersclassroom.com or by visiting his website at http://www.tradersclassroom.com. You can also follow him on Twitter @TradersClassrm.
| Garland, Tx | |
| Website: | www.tradersclassroom.com |
| E-mail address: | inquiry@tradersclassroom.com |
Click here for more information about our publications!
PRINT THIS ARTICLE

Request Information From Our Sponsors
- StockCharts.com, Inc.
- Candle Patterns
- Candlestick Charting Explained
- Intermarket Technical Analysis
- John Murphy on Chart Analysis
- John Murphy's Chart Pattern Recognition
- John Murphy's Market Message
- MurphyExplainsMarketAnalysis-Intermarket Analysis
- MurphyExplainsMarketAnalysis-Visual Analysis
- StockCharts.com
- Technical Analysis of the Financial Markets
- The Visual Investor
- VectorVest, Inc.
- Executive Premier Workshop
- One-Day Options Course
- OptionsPro
- Retirement Income Workshop
- Sure-Fire Trading Systems (VectorVest, Inc.)
- Trading as a Business Workshop
- VectorVest 7 EOD
- VectorVest 7 RealTime/IntraDay
- VectorVest AutoTester
- VectorVest Educational Services
- VectorVest OnLine
- VectorVest Options Analyzer
- VectorVest ProGraphics v6.0
- VectorVest ProTrader 7
- VectorVest RealTime Derby Tool
- VectorVest Simulator
- VectorVest Variator
- VectorVest Watchdog