HOT TOPICS LIST
- MACD
- Fibonacci
- RSI
- Gann
- ADXR
- Stochastics
- Volume
- Triangles
- Futures
- Cycles
- Volatility
- ZIGZAG
- MESA
- Retracement
- Aroon
INDICATORS LIST
LIST OF TOPICS
PRINT THIS ARTICLE
by David Penn
As emerging markets step back into the light, Indian closed-end funds look to be climbing back onto the bright side.
Position: N/A
David Penn
Technical Writer for Technical Analysis of STOCKS & COMMODITIES magazine, Working-Money.com, and Traders.com Advantage.
PRINT THIS ARTICLE
TECHNICAL ANALYSIS
The "Other" Asia Bottoms
02/15/02 10:14:39 AMby David Penn
As emerging markets step back into the light, Indian closed-end funds look to be climbing back onto the bright side.
Position: N/A
| With U.S. investments continuing to be viewed as overvalued by all of the most bullish commentators and analysts, a growing chorus of internationally oriented investors has been singing the relative praises of investment in Asia. Writing off Japan, many have looked to the depressed shares of Asian equities markets such as Taiwan, South Korea and Hong Kong for dramatic undervaluations and a lack of correlation with the U.S. equities market. |
| In an earlier article, I pointed to 2002 advances in South Korean, Taiwanese and Malaysian exchange traded funds ("Asian Tigers Unite!" Traders.com Advantage, 1/31/02). But there's more to Asia than the Far East. India, the world's largest democracy, probably qualifies as one of the most overlooked investment areas in the world. Given the headaches investors seem willing to endure just for the chance to send dollars to places like Singapore and Indonesia, it is a mystery why investors have not paid more attention to the equities markets of India. |

|
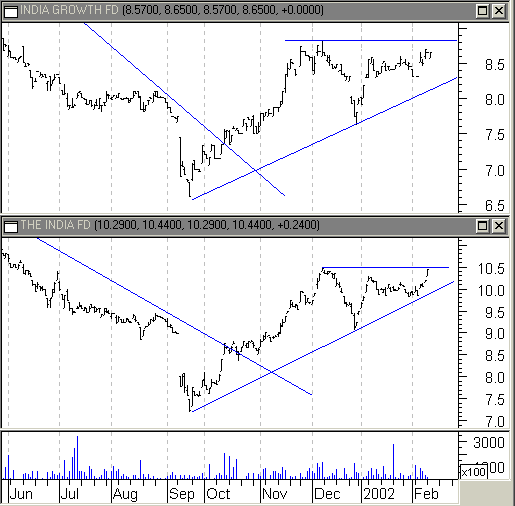
| After putting in a solid September 2001 bottom, Indian equities are headed up. |
| Graphic provided by: MetaStock. |
| |
| Accessibility may be one reason. Unlike many other industrialized Asian nations, India has no exchange-traded index fund to make it easy for investors looking specifically for Indian exposure to get it in one shot. Even Asia-Pacific mutual funds are no guarantee of Indian exposure, with many "Asian" funds apparently under the belief that Asia stops at the Himalayan mountains. Thus, outside of individual Indian stocks, closed-end funds (CEFs) are one effective way to get specific Indian equity exposure. There are four large, relatively liquid, closed-end India funds: India Funds (IFN) and India Growth Fund (IGF), both of which are shown here; as well as the Jardine Fleming India Fund (JFI) and the Morgan Stanley Dean Witter India Investment Fund (IIF). |
| All of these funds are trading at significant discounts to net asset value (NAV), discounts (and premiums) being the major ways of valuing closed-end funds, which otherwise trade on the major stock exchanges like stocks. Of course, a major discount does also suggest a closed-end fund that has been suffering from exceptionally low demand (generally because of underperformance), thus simply buying big discount closed-end funds makes about as much sense as blindly buying stocks that have plummeted in value and calling them "bargains." Nevertheless, when there is a combination of a significant discount to NAV and a compelling technical picture, those interested in closed-end funds are advised to pay close attention. |
| The technical picture for India--as reflected in the rising prices of the India Fund and the India Growth Fund--looks to be improving after a bear market that lasted about a year and a half. In fact, both closed-end funds look to have put in bottoms in September 2001 around the time of the terrorist attacks in the United States. These bottoms arrived after a 64% drop in the India Fund (21 to 7.6) and a 69% drop in the India Growth Fund (21 to 6.6). Since those bottoms, the India Fund has appreciated some 40% and the India Growth Fund some 33%. Currently, both CEFs are stuck in lines that developed in the wake of December corrections and subsequent rallies in Indian equities--although the India Fund looks to be making a more direct test of its December highs compared to its Growth counterpart. |
Technical Writer for Technical Analysis of STOCKS & COMMODITIES magazine, Working-Money.com, and Traders.com Advantage.
| Title: | Technical Writer |
| Company: | Technical Analysis, Inc. |
| Address: | 4757 California Avenue SW |
| Seattle, WA 98116 | |
| Phone # for sales: | 206 938 0570 |
| Fax: | 206 938 1307 |
| Website: | www.Traders.com |
| E-mail address: | DPenn@traders.com |
Traders' Resource Links | |
| Charting the Stock Market: The Wyckoff Method -- Books | |
| Working-Money.com -- Online Trading Services | |
| Traders.com Advantage -- Online Trading Services | |
| Technical Analysis of Stocks & Commodities -- Publications and Newsletters | |
| Working Money, at Working-Money.com -- Publications and Newsletters | |
| Traders.com Advantage -- Publications and Newsletters | |
| Professional Traders Starter Kit -- Software | |
Click here for more information about our publications!
PRINT THIS ARTICLE

Request Information From Our Sponsors
- VectorVest, Inc.
- Executive Premier Workshop
- One-Day Options Course
- OptionsPro
- Retirement Income Workshop
- Sure-Fire Trading Systems (VectorVest, Inc.)
- Trading as a Business Workshop
- VectorVest 7 EOD
- VectorVest 7 RealTime/IntraDay
- VectorVest AutoTester
- VectorVest Educational Services
- VectorVest OnLine
- VectorVest Options Analyzer
- VectorVest ProGraphics v6.0
- VectorVest ProTrader 7
- VectorVest RealTime Derby Tool
- VectorVest Simulator
- VectorVest Variator
- VectorVest Watchdog
- StockCharts.com, Inc.
- Candle Patterns
- Candlestick Charting Explained
- Intermarket Technical Analysis
- John Murphy on Chart Analysis
- John Murphy's Chart Pattern Recognition
- John Murphy's Market Message
- MurphyExplainsMarketAnalysis-Intermarket Analysis
- MurphyExplainsMarketAnalysis-Visual Analysis
- StockCharts.com
- Technical Analysis of the Financial Markets
- The Visual Investor
