HOT TOPICS LIST
- MACD
- Fibonacci
- RSI
- Gann
- ADXR
- Stochastics
- Volume
- Triangles
- Futures
- Cycles
- Volatility
- ZIGZAG
- MESA
- Retracement
- Aroon
INDICATORS LIST
LIST OF TOPICS
PRINT THIS ARTICLE
by Koos van der Merwe
We all know that that a correction is due. The problem is, when is it going to happen?
Position: Sell
Koos van der Merwe
Has been a technical analyst since 1969, and has worked as a futures and options trader with First Financial Futures in Johannesburg, South Africa.
PRINT THIS ARTICLE
ELLIOTT WAVE
Correction Is Due Sometime Soon, So Be Careful Out There
01/19/11 02:23:42 PMby Koos van der Merwe
We all know that that a correction is due. The problem is, when is it going to happen?
Position: Sell
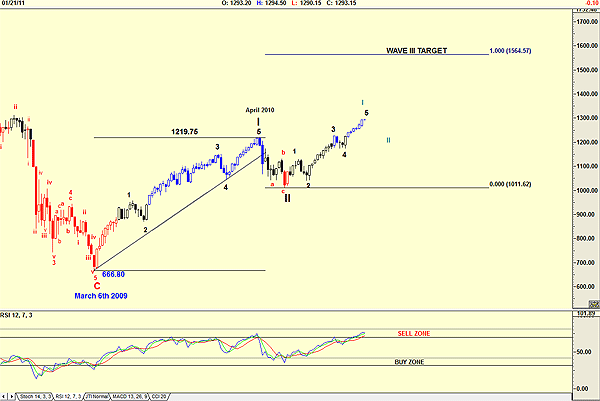
| A minor fifth-wave correction of both the major indexes is due, and traders are staying out of the market. Investors, on the other hand, are enthusiastic with the market recovery, and are buying shares, pushing the indexes into even higher levels, and on falling volume. This is typical fifth-wave top situation, where those who do not follow technical analysis jump into the market because the pundits on TV are enthusiastic, stating the market has recovered and is climbing. They are not wrong, but they are talking long term, not short term. Buying is definitely on the cards. It is the "when" to buy that is important. |

|
| FIGURE 1: S&P 500, WEEKLY |
| Graphic provided by: AdvancedGET. |
| |
| Figure 1 is an weekly chart of the Standard & Poor's 500. It is still confirming that the wave III target is 1564.57, and that the index is in a minor fifth-wave count. I still believe that this will lead to wave 1 of wave III, and until my charts tell me otherwise, I will stick with it. Do note that the relative strength index (RSI) is overbought and is in the sell zone. It can turn at any time depending on market sentiment. |

|
| FIGURE 2: S&P 500, DAILY |
| Graphic provided by: AdvancedGET. |
| |
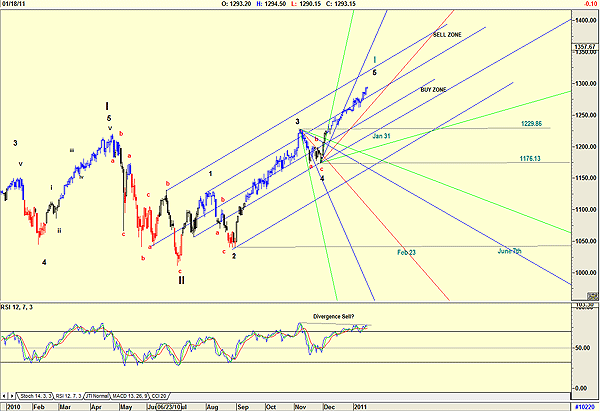
| Figure 2 is still suggesting that the index is in the Gann sell zone, and the RSI is definitely showing a divergence buy signal. Dates, however have changed. Gann fans are now suggesting January 31, February 23, and June 7 as dates to watch. The chart is also suggesting that the correction should end somewhere between 1176.13 to 1229.86, the fourth wave of lesser degree. A correction in the market is due, but the index is still showing strength in spite of what the indicators are saying. Today, we are seeing Citi Group and Apple correct. Others will surely follow. Be careful out there. |
Has been a technical analyst since 1969, and has worked as a futures and options trader with First Financial Futures in Johannesburg, South Africa.
| Address: | 3256 West 24th Ave |
| Vancouver, BC | |
| Phone # for sales: | 6042634214 |
| E-mail address: | petroosp@gmail.com |
Click here for more information about our publications!
Comments
Date: 01/20/11Rank: 5Comment:

Request Information From Our Sponsors
- StockCharts.com, Inc.
- Candle Patterns
- Candlestick Charting Explained
- Intermarket Technical Analysis
- John Murphy on Chart Analysis
- John Murphy's Chart Pattern Recognition
- John Murphy's Market Message
- MurphyExplainsMarketAnalysis-Intermarket Analysis
- MurphyExplainsMarketAnalysis-Visual Analysis
- StockCharts.com
- Technical Analysis of the Financial Markets
- The Visual Investor
- VectorVest, Inc.
- Executive Premier Workshop
- One-Day Options Course
- OptionsPro
- Retirement Income Workshop
- Sure-Fire Trading Systems (VectorVest, Inc.)
- Trading as a Business Workshop
- VectorVest 7 EOD
- VectorVest 7 RealTime/IntraDay
- VectorVest AutoTester
- VectorVest Educational Services
- VectorVest OnLine
- VectorVest Options Analyzer
- VectorVest ProGraphics v6.0
- VectorVest ProTrader 7
- VectorVest RealTime Derby Tool
- VectorVest Simulator
- VectorVest Variator
- VectorVest Watchdog
