HOT TOPICS LIST
- MACD
- Fibonacci
- RSI
- Gann
- ADXR
- Stochastics
- Volume
- Triangles
- Futures
- Cycles
- Volatility
- ZIGZAG
- MESA
- Retracement
- Aroon
INDICATORS LIST
LIST OF TOPICS
PRINT THIS ARTICLE
by Donald W. Pendergast, Jr.
Parabolic rises in stocks eventually fizzle out, usually bringing prices back to a meaningful support level sooner or later. Here's a look at a high-flying energy stock that may have moved too high, too fast and is now likely ripe for a reversal.
Position: N/A
Donald W. Pendergast, Jr.
Donald W. Pendergast is a financial markets consultant who offers specialized services to stock brokers and high net worth individuals who seek a better bottom line for their portfolios.
PRINT THIS ARTICLE
CHART ANALYSIS
Pullback Likely From Extreme For Marathon Oil
01/14/11 01:02:43 PMby Donald W. Pendergast, Jr.
Parabolic rises in stocks eventually fizzle out, usually bringing prices back to a meaningful support level sooner or later. Here's a look at a high-flying energy stock that may have moved too high, too fast and is now likely ripe for a reversal.
Position: N/A
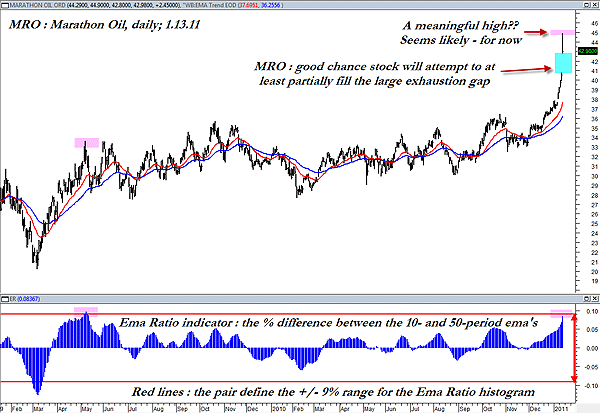
| Lately, quite a few Standard & Poor's 500 stocks have been exhibiting exhaustion or parabolic blow-off chart patterns, and this chart of Marathon Oil (MRO) is one of the most extreme of all (Figure 1). The entire energy services industry group (IEZ) has made a solid advance over the last seven months (about 50%) and appears to be entering a pause phase, one that may or may not lead to a meaningful correction for the group. MRO is one of the strongest stocks in this group, and January 13's sharp intraday reversal after a parabolic exhaustion gap move higher in this stock may be a clear sign that there simply is no demand for MRO at the $45.00 zone. That may change in days and weeks to come, but for now, traders should anticipate that MRO will attempt to close (or partially close) the recent exhaustion gap before making a tradable intraday low. |

|
| FIGURE 1: MRO, DAILY. Any time the EMA ratio (ER) histogram approaches the 9% level (0.09), the odds increase that a significant reversal and/or pullback is approaching. In this case, the stock reversed intraday after staging a sharp exhaustion gap higher in a terminal parabolic blow-off move. Look for MRO to attempt to close the gap within the next few sessions. |
| Graphic provided by: MetaStock. |
| Graphic provided by: WB EMA Trend EOD from Profit Trader for MetaStock. |
| |
| At the bottom of the chart, we see the EMA ratio indicator (ER) that I created in MetaStock; any time the ratio exceeds 0.09 on the daily chart (which is simply a 9% difference between the 10- and 50-period exponential moving averages), we can normally expect the stock to be quickly approaching a powerful reversal zone. The horizontal red lines plotted above and below the blue ER histogram powerfully depict this +/-9% ER range in MRO shares. You need to use this particular technical tool in conjunction with several others to benefit the most from it, but in this example, with the reversal occurring after a parabolic exhaustion gap and an ER reading of 0.08367, we can be reasonably sure that this stock still has some more downside ahead before stabilizing. See Figure 2. |

|
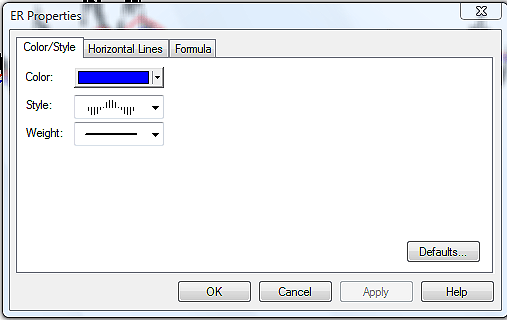
| FIGURE 2: EMA RATIO. Here's how to format the color and style of the EMA ratio indicator. The histogram format is usually best for this valuable technical tool. |
| Graphic provided by: MetaStock. |
| Graphic provided by: MetaStock Indicator Builder. |
| |
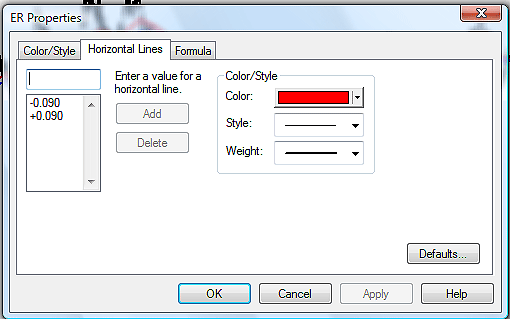
| The indicator is easily created in MetaStock -- here's the same code I used to plot it on this chart: (Mov(C,10,E)-Mov(C,50,E)) / Mov(C,50,E) The other graphics show how easy it is to format the indicator to appear exactly as shown on the daily chart of MRO. With a bit of trial and error and experimentation, you'll be amazed at how much better you'll be able to anticipate significant reversals in the stocks, indexes, and futures markets that you follow. See Figure 3. |

|
| FIGURE 3: ER PROPERTIES. And here's how to format the horizontal lines surrounding the ER histogram. Be sure to put a minus sign to obtain a negative value for the lower line. A contrasting color seems to be the easiest to use, but feel free to use any color that works best for you. |
| Graphic provided by: MetaStock. |
| Graphic provided by: MetaStock Indicator Builder. |
| |
Donald W. Pendergast is a financial markets consultant who offers specialized services to stock brokers and high net worth individuals who seek a better bottom line for their portfolios.
| Title: | Writer, market consultant |
| Company: | Linear Trading Systems LLC |
| Jacksonville, FL 32217 | |
| Phone # for sales: | 904-239-9564 |
| E-mail address: | lineartradingsys@gmail.com |
Traders' Resource Links | |
| Linear Trading Systems LLC has not added any product or service information to TRADERS' RESOURCE. | |
Click here for more information about our publications!
PRINT THIS ARTICLE

Request Information From Our Sponsors
- VectorVest, Inc.
- Executive Premier Workshop
- One-Day Options Course
- OptionsPro
- Retirement Income Workshop
- Sure-Fire Trading Systems (VectorVest, Inc.)
- Trading as a Business Workshop
- VectorVest 7 EOD
- VectorVest 7 RealTime/IntraDay
- VectorVest AutoTester
- VectorVest Educational Services
- VectorVest OnLine
- VectorVest Options Analyzer
- VectorVest ProGraphics v6.0
- VectorVest ProTrader 7
- VectorVest RealTime Derby Tool
- VectorVest Simulator
- VectorVest Variator
- VectorVest Watchdog
- StockCharts.com, Inc.
- Candle Patterns
- Candlestick Charting Explained
- Intermarket Technical Analysis
- John Murphy on Chart Analysis
- John Murphy's Chart Pattern Recognition
- John Murphy's Market Message
- MurphyExplainsMarketAnalysis-Intermarket Analysis
- MurphyExplainsMarketAnalysis-Visual Analysis
- StockCharts.com
- Technical Analysis of the Financial Markets
- The Visual Investor
