HOT TOPICS LIST
- MACD
- Fibonacci
- RSI
- Gann
- ADXR
- Stochastics
- Volume
- Triangles
- Futures
- Cycles
- Volatility
- ZIGZAG
- MESA
- Retracement
- Aroon
INDICATORS LIST
LIST OF TOPICS
PRINT THIS ARTICLE
by Donald W. Pendergast, Jr.
The US Dollar Index staged a remarkable turnaround from early November to early December 2010, but since then it has been trapped in a trading range. Time for the rally to resume -- or not?
Position: N/A
Donald W. Pendergast, Jr.
Donald W. Pendergast is a financial markets consultant who offers specialized services to stock brokers and high net worth individuals who seek a better bottom line for their portfolios.
PRINT THIS ARTICLE
ACCUM./DIST. CHAIKIN
Will The Rally Resume In The Dollar Index?
01/12/11 08:44:31 AMby Donald W. Pendergast, Jr.
The US Dollar Index staged a remarkable turnaround from early November to early December 2010, but since then it has been trapped in a trading range. Time for the rally to resume -- or not?
Position: N/A
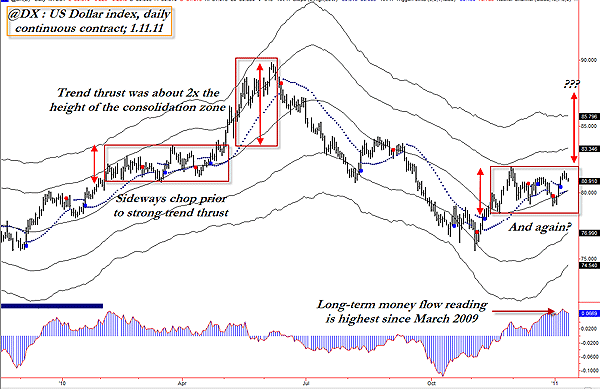
| Similar to my article yesterday ("Time To Flee Sara Lee?" January 11, 2011), this one will also deal with some general principles that may help you be better prepared for whatever trading opportunities may present themselves. Let's see if there is any similarity between the US Dollar Index's current technical setup with that previously seen in the winter/spring of 2010 (see Figure 1). |

|
| FIGURE 1: DX, DAILY. Somebody must be pretty bullish on the US Dollar Index, given that the long-term Chaikin Money flow indicator is at its highest reading since March 2009. A daily close above the recent swing high at $81.635 would be especially bullish, given the current chart configuration. |
| Graphic provided by: TradeStation. |
| |
| The US Dollar Index (DX) made significant lows in the last part of 2009 and then again in 2010, after which a meaningful reversal took place. We all know how the late 2009 to mid-2010 rally turned out, with the DX rising nearly 20% in six months. So how about now, with the DX up nicely from its November low? Will its current period of sideways thrashing also resolve itself with a similarly strong bullish continuation move, perhaps en route to fresh post-crash highs? |
| Long-term money flow (CMF)(100) was in the positive zone (above its zero line) when the DX finally snapped free of its three-month-old consolidation in May 2010, and the base of the launch also coincided with a Roy Kelly Trend Pro TP Trigger Point buy signal (blue dot), one occurring close to the Keltner midline (a 45-period exponential moving average [EMA]). We see a reasonably similar setup under way now -- the blue buy trigger dot occurring close to the midline during a meaningful congestion zone. This time, however, the money flow situation is even stronger, with the CMF 100 actually posting the highest readings since March 2009. The 2010 breakout managed to produce a move that was twice the price range of the consolidation from which it emanated, so maybe we can have a bit of fun and apply a similar bit of dirt-simple logic to this new "in-process" pattern. Assuming that actually happens, such a two-for-one move higher could result in a DX value close to 87.50 or so. We don't actually know how this pattern will play out, of course, but it would still pay to keep an eye on it anyway, as it could allow for any number of short-term, intraday swing setups during the lifespan of a sharp upthrust out of the consolidation. I haven't backtested the Roy Kelly indicators in TradeStation (it can be done, by the way) but as you can see, they do a really good job of getting a trader in on every significant trending move. With a bit of fine-tuning and a solid understanding of how to wisely use key support/resistance levels, price cycles, and time/price dynamics, these additions of these deceptively simple-looking indicators may prove to be a very valuable part of your trading system toolbox. |
Donald W. Pendergast is a financial markets consultant who offers specialized services to stock brokers and high net worth individuals who seek a better bottom line for their portfolios.
| Title: | Writer, market consultant |
| Company: | Linear Trading Systems LLC |
| Jacksonville, FL 32217 | |
| Phone # for sales: | 904-239-9564 |
| E-mail address: | lineartradingsys@gmail.com |
Traders' Resource Links | |
| Linear Trading Systems LLC has not added any product or service information to TRADERS' RESOURCE. | |
Click here for more information about our publications!
PRINT THIS ARTICLE

Request Information From Our Sponsors
- StockCharts.com, Inc.
- Candle Patterns
- Candlestick Charting Explained
- Intermarket Technical Analysis
- John Murphy on Chart Analysis
- John Murphy's Chart Pattern Recognition
- John Murphy's Market Message
- MurphyExplainsMarketAnalysis-Intermarket Analysis
- MurphyExplainsMarketAnalysis-Visual Analysis
- StockCharts.com
- Technical Analysis of the Financial Markets
- The Visual Investor
- VectorVest, Inc.
- Executive Premier Workshop
- One-Day Options Course
- OptionsPro
- Retirement Income Workshop
- Sure-Fire Trading Systems (VectorVest, Inc.)
- Trading as a Business Workshop
- VectorVest 7 EOD
- VectorVest 7 RealTime/IntraDay
- VectorVest AutoTester
- VectorVest Educational Services
- VectorVest OnLine
- VectorVest Options Analyzer
- VectorVest ProGraphics v6.0
- VectorVest ProTrader 7
- VectorVest RealTime Derby Tool
- VectorVest Simulator
- VectorVest Variator
- VectorVest Watchdog
