HOT TOPICS LIST
- MACD
- Fibonacci
- RSI
- Gann
- ADXR
- Stochastics
- Volume
- Triangles
- Futures
- Cycles
- Volatility
- ZIGZAG
- MESA
- Retracement
- Aroon
INDICATORS LIST
LIST OF TOPICS
PRINT THIS ARTICLE
by Koos van der Merwe
I hate i-Shares and ETFs because they are used by hedge funds to play the market. Hedge funds are not as tightly restricted as brokerage houses... yet.
Position: N/A
Koos van der Merwe
Has been a technical analyst since 1969, and has worked as a futures and options trader with First Financial Futures in Johannesburg, South Africa.
PRINT THIS ARTICLE
MOVING AVERAGES
Playing With i-Shares And ETFs
01/10/11 02:26:59 PMby Koos van der Merwe
I hate i-Shares and ETFs because they are used by hedge funds to play the market. Hedge funds are not as tightly restricted as brokerage houses... yet.
Position: N/A
| We all know what a mutual fund is. It is a portfolio of shares of a specific category managed by a portfolio manager. They receive a fee for their expertise and investors buy/sell that fund based on performance. When exchange traded funds (ETFs) and i-Shares first came out, they competed with mutual funds, with the advantage that there was no management fee. One could buy and sell them like an ordinary stock, whereas mutual funds had restrictions. In Canada, for example, should you buy and then sell a mutual fund within 90 days, there is a 2% additional charge. This led to mutual funds falling out of favor with investors with many fund companies consolidating funds, and even vanishing from the horizon as they lost income and consolidated with other fund companies. If this is so, then why do I hate ETFs and i-Shares? By buying an ETF or i-Share, we are buying an index of stocks, bonds, indexes, foreign indexes, currencies -- you name it, it is there. Some ETFs and i-Shares perform better than others. Some perform not at all and soon vanish. They are liked by hedge funds, which theoretically, should "hedge" against their purchase in the options or futures markets, or use the ETF/i-Share to hedge against a portfolio of stocks they may own. The recent meltdown in the market, where many hedge funds saw their tails, shows that they do not practice what they preach. They do not hedge/balance their portfolios. Having said all this, how would you, the average investor, play the ETF/i-Share market successfully? I have found that the only way to do this, because of the volatility in many cases, is by using the JM internal band strategy. The JM internal band strategy is simply a 15-period simple moving average offset upward by 2% and downward by -2%. However, when playing the ETF/i-Shares market, the percentages should be changed to fit the chart. They could be 1% and -1% or 3% and -3%, or any other percentage, as long as it fits the chart, and by this I mean that any correction will not needlessly take one out of the trade too quickly. |

|
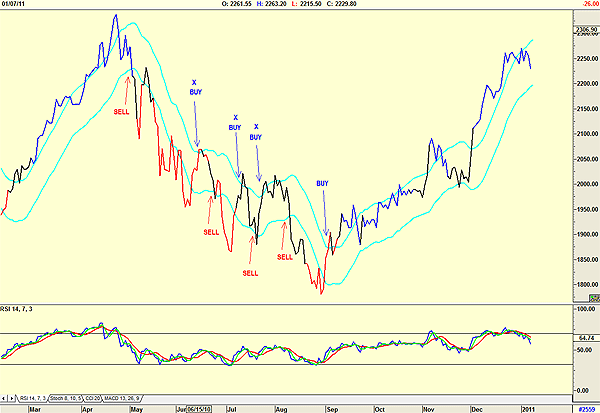
| FIGURE 1: ORIGINAL JM INTERNAL BAND STRATEGY |
| Graphic provided by: AdvancedGET. |
| |
| In Figure 1, I show with an "X" three buy signals that would have resulted in losses. Admittedly, those losses would have been made up with the buy signal without the X. We could also have waited for the relative strength index (RSI) to suggest a buy before buying. |

|
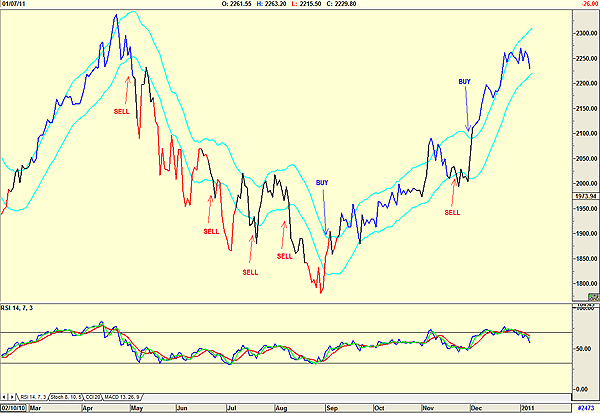
| FIGURE 2: ADJUSTED JM INTERNAL BAND STRATEGY |
| Graphic provided by: AdvancedGET. |
| |
| However, look at Figure 2. In this chart I have offset the JM band by 3% and -1%. The width structure of the band remains the same, and there are no losses. The profitability of the buy, however, would have been reduced but that would not matter, because there are no losses. The question is, how do we know when to offset the band? The answer is usually after the first buy and sell signal is given, or if it is not in sync with the RSI. We should therefore always look at previous history to find out whether the JM internal band is synced correctly. If not, adjust the percentages. |

|
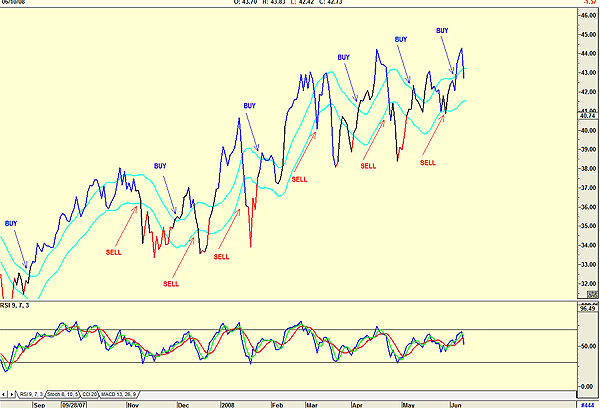
| FIGURE 3: VOLATILE ETF WITH JM INTERNAL BAND STRATEGY |
| Graphic provided by: AdvancedGET. |
| |
| As an example, Figure 3 shows a chart I would not play using the JM internal band strategy, because the volatility of the i-Unit is too great. When we use the JM Internal band for investing, we must always look for a share that offers low volatility but steady growth. Playing the ETF/i-Shares using the strategy can be unprofitable. |
Has been a technical analyst since 1969, and has worked as a futures and options trader with First Financial Futures in Johannesburg, South Africa.
| Address: | 3256 West 24th Ave |
| Vancouver, BC | |
| Phone # for sales: | 6042634214 |
| E-mail address: | petroosp@gmail.com |
Click here for more information about our publications!
PRINT THIS ARTICLE

Request Information From Our Sponsors
- StockCharts.com, Inc.
- Candle Patterns
- Candlestick Charting Explained
- Intermarket Technical Analysis
- John Murphy on Chart Analysis
- John Murphy's Chart Pattern Recognition
- John Murphy's Market Message
- MurphyExplainsMarketAnalysis-Intermarket Analysis
- MurphyExplainsMarketAnalysis-Visual Analysis
- StockCharts.com
- Technical Analysis of the Financial Markets
- The Visual Investor
- VectorVest, Inc.
- Executive Premier Workshop
- One-Day Options Course
- OptionsPro
- Retirement Income Workshop
- Sure-Fire Trading Systems (VectorVest, Inc.)
- Trading as a Business Workshop
- VectorVest 7 EOD
- VectorVest 7 RealTime/IntraDay
- VectorVest AutoTester
- VectorVest Educational Services
- VectorVest OnLine
- VectorVest Options Analyzer
- VectorVest ProGraphics v6.0
- VectorVest ProTrader 7
- VectorVest RealTime Derby Tool
- VectorVest Simulator
- VectorVest Variator
- VectorVest Watchdog
