HOT TOPICS LIST
- MACD
- Fibonacci
- RSI
- Gann
- ADXR
- Stochastics
- Volume
- Triangles
- Futures
- Cycles
- Volatility
- ZIGZAG
- MESA
- Retracement
- Aroon
INDICATORS LIST
LIST OF TOPICS
PRINT THIS ARTICLE
by Koos van der Merwe
So we know that a correction is due. How long will it last?
Position: Sell
Koos van der Merwe
Has been a technical analyst since 1969, and has worked as a futures and options trader with First Financial Futures in Johannesburg, South Africa.
PRINT THIS ARTICLE
ELLIOTT WAVE
The Coming Correction
01/10/11 02:05:11 PMby Koos van der Merwe
So we know that a correction is due. How long will it last?
Position: Sell
| In my article last week, "The First Rule," I discussed how and why the wave count currently in force does not look like a major Wave III, and that it could be a Wave 1 of Wave III. In this article I want to discuss the time we can expect the correction to bottom, and how far it could fall. |

|
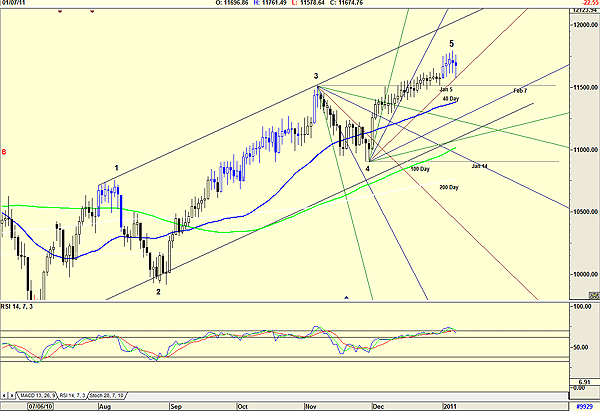
| FIGURE 1: DJIA, DAILY |
| Graphic provided by: AdvancedGET. |
| |
| Figure 1 is a daily chart of the Dow Jones Industrial Average (DJIA) and show that a wave 5 could be in the process. I write "could," because when we look back at the relative strength index (RSI) signal, it suggests that the RSI could stay at overbought levels for a lengthy period before a sell signal is given. We could in fact see the DJIA climbing to test the upper trendline before selling off. Do note the dates suggested by the Gann fan, namely January 14, and February 7. These dates are suggesting turning points, should the DJIA fall. Do note the high that occurred on January 5. |

|
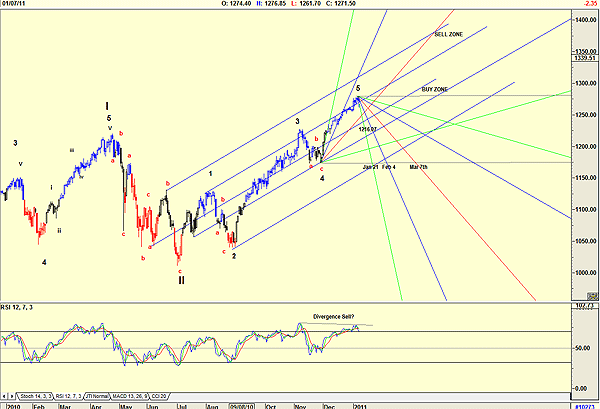
| FIGURE 2: S&P 500, DAILY |
| Graphic provided by: AdvancedGET. |
| |
| Figure 2 is a daily chart of the Standard & Poor's 500 and shows how the index is in the sell zone as depicted by Gann projections. Here I have taken the 2x1 line of the Gann fan and drawn it from the high and low pivot points of the index. Note that the RSI has given more concise signals and could be suggesting a divergence sell signal. The dates suggested by the Gann fan are different from that of the dates given in Figure 1, by a matter of three days. Do note that the buy zone suggested by the Gann lines is within the fourth wave of lesser degree with its lowest level, on January 21 at 1216.07. Both the DJIA and the S&P 500 are suggesting that a correction is now due, but a mild one, that could last until January 21 or February 4 with March 7 at the outside. If my wave count as stated in the previous article is correct, and that this current five-wave count is a Wave 1 of Wave III, then the correction presents an outstanding buying opportunity. I must mention that in listening to Fed chair Bernanke when he spoke recently, that although he is optimistic about the US economic recovery, he did play down his enthusiasm. He has probably learned that it is always better to err on the side of caution and downplay his success in the economic recovery. Last year at this time, Republicans and their henchmen were calling for a double-dip recession. Amazing how short memory can be. |
Has been a technical analyst since 1969, and has worked as a futures and options trader with First Financial Futures in Johannesburg, South Africa.
| Address: | 3256 West 24th Ave |
| Vancouver, BC | |
| Phone # for sales: | 6042634214 |
| E-mail address: | petroosp@gmail.com |
Click here for more information about our publications!
Comments
Date: 01/15/11Rank: 5Comment:
Date: 01/16/11Rank: 4Comment:

Request Information From Our Sponsors
- StockCharts.com, Inc.
- Candle Patterns
- Candlestick Charting Explained
- Intermarket Technical Analysis
- John Murphy on Chart Analysis
- John Murphy's Chart Pattern Recognition
- John Murphy's Market Message
- MurphyExplainsMarketAnalysis-Intermarket Analysis
- MurphyExplainsMarketAnalysis-Visual Analysis
- StockCharts.com
- Technical Analysis of the Financial Markets
- The Visual Investor
- VectorVest, Inc.
- Executive Premier Workshop
- One-Day Options Course
- OptionsPro
- Retirement Income Workshop
- Sure-Fire Trading Systems (VectorVest, Inc.)
- Trading as a Business Workshop
- VectorVest 7 EOD
- VectorVest 7 RealTime/IntraDay
- VectorVest AutoTester
- VectorVest Educational Services
- VectorVest OnLine
- VectorVest Options Analyzer
- VectorVest ProGraphics v6.0
- VectorVest ProTrader 7
- VectorVest RealTime Derby Tool
- VectorVest Simulator
- VectorVest Variator
- VectorVest Watchdog
