HOT TOPICS LIST
- MACD
- Fibonacci
- RSI
- Gann
- ADXR
- Stochastics
- Volume
- Triangles
- Futures
- Cycles
- Volatility
- ZIGZAG
- MESA
- Retracement
- Aroon
INDICATORS LIST
LIST OF TOPICS
PRINT THIS ARTICLE
by Andrew Hetherington
What if I were to tell you your future lies within the networks. You'd probably think, sure it does and where is that swampland in Florida for sale? Well, it's true. It's always been my intention to buy what everyone else is selling. As simple as that sounds, you need to know when to buy.
Position: N/A
Andrew Hetherington
Classic Dow Theorist who trades as a pure technician, using pattern recognition.
PRINT THIS ARTICLE
HEAD & SHOULDERS
Reversal Patterns in the Networks
02/12/02 11:06:44 AMby Andrew Hetherington
What if I were to tell you your future lies within the networks. You'd probably think, sure it does and where is that swampland in Florida for sale? Well, it's true. It's always been my intention to buy what everyone else is selling. As simple as that sounds, you need to know when to buy.
Position: N/A
| Everyone has seen how battered this sector has become and it's natural that we would all be a little gun shy. Most in this sector have dropped from lofty heights into single digits like Nortel, JDS Uniphase and Lucent to name a few. Most have had some decent gains off of the September low, which are currently retracing. This was destined to happen after big bounces from those lows. |
| Now may be the time to get back in. They are all making the same head and shoulders bottom reversal patterns, just like the Nasdaq and the S&P Indices. Many of you are familiar with this style of pattern but in order to buy at the bottom you have to trust what you see. But most of these patterns are not yet complete and by buying in early before they break out, you run the risk of having losses. These are prices that you may not see for many years to come. Naturally, you wouldn't want to use any margin in this circumstance in case it takes more time to go up than you anticipate or goes south for a while before climbing. Three such equities are Juniper (JNPR), JDS Uniphase (JDSU) and Redback (RBAK). I should also give an honourable mention to Cisco (CSCO) and Nortel (NT) although not as perfect a pattern, they are all very similar. |

|
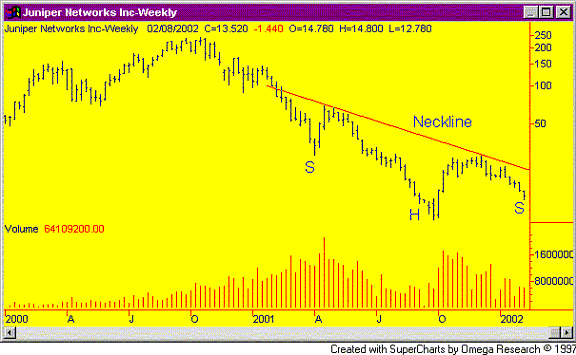
| Figure 1: Weekly Chart for JNPR. |
| Graphic provided by: SuperCharts. |
| |
| Juniper has completed the left shoulder, the head, and is completing the first half of the right shoulder. It's on this dip to form the bottom of the right shoulder where you make all your gains and buy in at what will be a very protected price point down the road. It closed at $13.41 on February 7, 2002. This could be a very good entry point, even though it could go as low as $8.90, the point where the head bottomed out. In addition, this is such a steep slope that the right shoulder may even go slightly lower than the head, but I don't think this will happen and $13.00 is a safe bet. |
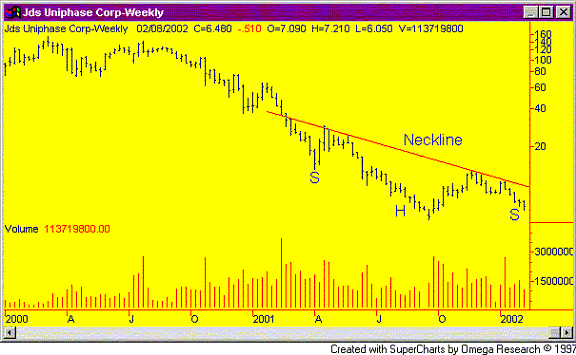
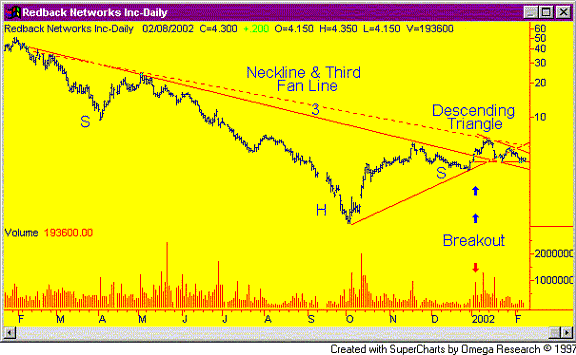
 Figure 2: Weekly chart for JDSU. JDS Uniphase is in the exact same situation as Juniper. The head and shoulders pattern is near completion. The price point is between $6.00 - $6.50, while it closed on February 7 at $6.30. Another safe entry point for down the road even though the head bottomed out at $5.12.  Figure 3: Daily chart for RBAK. Redback, on the other hand, has broken the third fan line to go topside with a significant increase in volume, while simultaneously breaking out from the head and shoulders pattern. Although the tendency is to creep down along this fan line before busting upwards, the $4.25 area seems to be a good time to enter. I have a small concern about the 1-month descending triangle that has formed after the breakout since this pattern has a bearish tendency, but I'm thinking long anyways. I'm hopeful that it won't break on the downside but if it does I would suggest hanging in there even if it goes as low as $2.70. Why $2.70? Well, if my interpretation is wrong it could end up dropping down to that area to finish what will be a right shoulder. Then my neckline would need to be adjusted, as shown by the dotted line on the Figure 3. |
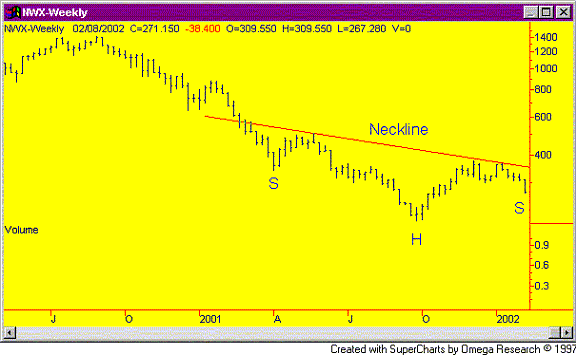
 Figure 4: Weekly chart for NWX. Coinciding with all these individual equities is the AMEX Network Index (NWX). This index hasn't been around long and has no volume to add to our puzzle but it does look very similar to my examples. This index topped out at 1401 on September 1, 2000, and bottomed on September 27, 2001 at 201. This is a staggering 85.7% drop. This large pattern is similar in duration to those in my examples. Why trust the larger patterns? I trust them since they are more powerful than small patterns and give you better bang for your buck. On all these examples I am awaiting a significant increase in volume to confirm that the patterns will fulfill their destiny. Perhaps the destiny of these equities will also be your own. |
Classic Dow Theorist who trades as a pure technician, using pattern recognition.
| Toronto, Canada |
Click here for more information about our publications!
Comments
Date: 02/12/02Rank: 4Comment:
Date: 02/12/02Rank: 5Comment: I like what I hear you say :-)
TS
Date: 02/12/02Rank: 4Comment:
Date: 02/15/02Rank: 5Comment:
Date: 02/19/02Rank: 4Comment:

|

Request Information From Our Sponsors
- StockCharts.com, Inc.
- Candle Patterns
- Candlestick Charting Explained
- Intermarket Technical Analysis
- John Murphy on Chart Analysis
- John Murphy's Chart Pattern Recognition
- John Murphy's Market Message
- MurphyExplainsMarketAnalysis-Intermarket Analysis
- MurphyExplainsMarketAnalysis-Visual Analysis
- StockCharts.com
- Technical Analysis of the Financial Markets
- The Visual Investor
- VectorVest, Inc.
- Executive Premier Workshop
- One-Day Options Course
- OptionsPro
- Retirement Income Workshop
- Sure-Fire Trading Systems (VectorVest, Inc.)
- Trading as a Business Workshop
- VectorVest 7 EOD
- VectorVest 7 RealTime/IntraDay
- VectorVest AutoTester
- VectorVest Educational Services
- VectorVest OnLine
- VectorVest Options Analyzer
- VectorVest ProGraphics v6.0
- VectorVest ProTrader 7
- VectorVest RealTime Derby Tool
- VectorVest Simulator
- VectorVest Variator
- VectorVest Watchdog
