

HOT TOPICS LIST
- MACD
- Fibonacci
- RSI
- Gann
- ADXR
- Stochastics
- Volume
- Triangles
- Futures
- Cycles
- Volatility
- ZIGZAG
- MESA
- Retracement
- Aroon
INDICATORS LIST
LIST OF TOPICS
PRINT THIS ARTICLE
by Chaitali Mohile
The bullish breakout of Walt Disney is likely to open fresh buying opportunities.
Position: Buy
Chaitali Mohile
Active trader in the Indian stock markets since 2003 and a full-time writer. Trading is largely based upon technical analysis.
PRINT THIS ARTICLE
BREAKOUTS
The Walt Disney Breakout
01/07/11 12:17:43 PMby Chaitali Mohile
The bullish breakout of Walt Disney is likely to open fresh buying opportunities.
Position: Buy
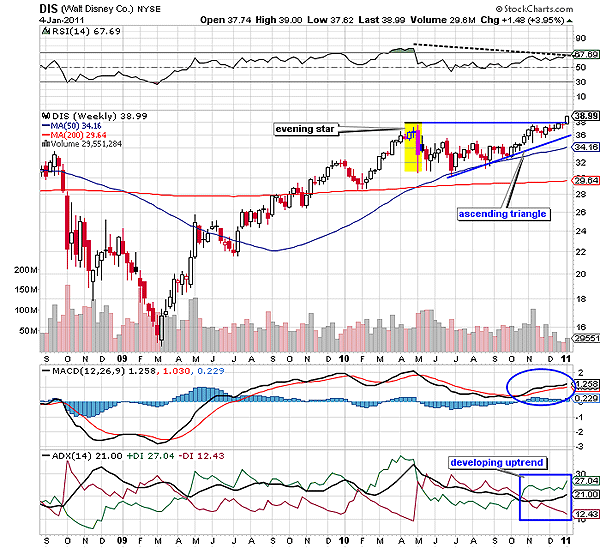
| The New Year rally encouraged Walt Disney (DIS) to undergo a robust bullish breakout. Recently, the stock has breached a previous high resistance formed in April 2010. DIS formed an evening star candlestick formation -- a bearish trend reversal -- in April 2010. Thereafter, the stock remained widely range bound with the lower support of the 50-day moving average (MA). Along with the MA support, the indicators in Figure 1 extended positive support to the price rally for sustaining in the bullish area. We can see that the relative strength index (RSI) (14) retraced from an overbought region, though it had strong support of the center line (50 levels). The average directional index (ADX) (14) descended from a developing downtrend region, thus weakening the bearish pressure on the rally. The moving average convergence/divergence (MACD) (12,26,9) remained positive after the bearish crossover in May 2010. |
|
| FIGURE 1: DIS, WEEKLY. The ascending triangle breakout breached the robust resistance level that discouraged the potential breakout in the past. |
| Graphic provided by: StockCharts.com. |
| |
| These conditions helped DIS sustain its bullishness during the range-bound phase. Later, the stock moved upward with the 50-day MA support. Gradually, DIS reached the prior high pivot at $38. Here, the stock consolidated for about two months in the year-end. This bullish rally developed a fresh uptrend in Figure 1 and the MACD (12,26,9) continued its journey in positive territory above the zero line. However, the negative divergence of the RSI (14) resulted in consolidation near the resistance area. |
| But the current bullish rally across the global financial markets pulled DIS above the historical resistance area. Although the RSI (14) has formed a lower high, the oscillator is in an overbought region above 60 levels, indicating bullish strength in the rally. The developing uptrend and the positive MACD (12,26,9) would enhance the bullishness in the breakout. Therefore, traders can trigger the fresh medium-term long positions for DIS. The lower and upper trendlines in Figure 1 shows an ascending triangle -- a bullish formation. Therefore, the DIS breakout has additional strength. Here, the potential target is 38 - 31 = 7 + 38 = 45. This would be an attractive target for the medium-term traders as well as investors. |
|
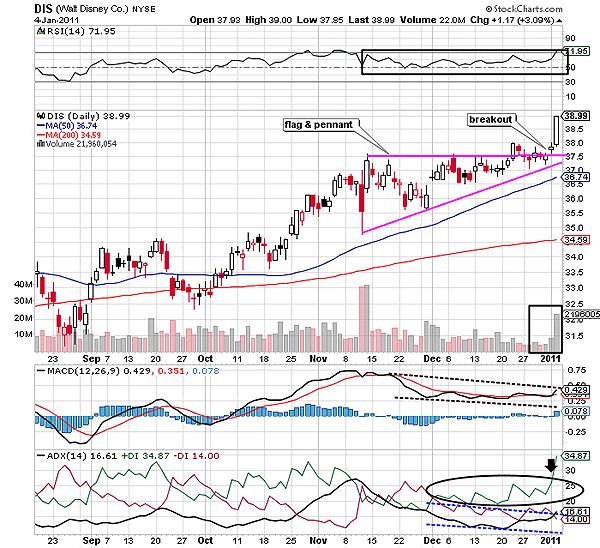
| FIGURE 2: DIS, DAILY. The stock formed the short-term flag & pennant bullish continuation pattern on the daily time frame. |
| Graphic provided by: StockCharts.com. |
| |
| The flag & pennant formation on the daily time frame in Figure 2 reconfirms the fresh buying opportunity for traders. After a small advance rally, DIS consolidated and formed the flag. Meantime, the bullish RSI (14) was ranged between 50 and 70 levels, and the MACD (12,26,9) turned volatile in the positive region. However, the ADX (14) slipped below 15, suggesting a weak trend. But the higher buying pressure shown by the positive directional index (+DI) in Figure 2 helped the stock to consolidate in higher area. |
| After the breakout, volume surged. The trend indicator is still weak but the +DI is rocketing, supporting the breakout movement. The other two indicators are bullish so the rally would continue to move north. Thus, DIS is definitely a stock to be considered for buying by short-term as well as medium-term traders. |
Active trader in the Indian stock markets since 2003 and a full-time writer. Trading is largely based upon technical analysis.
| Company: | Independent |
| Address: | C1/3 Parth Indraprasth Towers. Vastrapur |
| Ahmedabad, Guj 380015 | |
| E-mail address: | chaitalimohile@yahoo.co.in |
Traders' Resource Links | |
| Independent has not added any product or service information to TRADERS' RESOURCE. | |
Click here for more information about our publications!
PRINT THIS ARTICLE

Request Information From Our Sponsors
- StockCharts.com, Inc.
- Candle Patterns
- Candlestick Charting Explained
- Intermarket Technical Analysis
- John Murphy on Chart Analysis
- John Murphy's Chart Pattern Recognition
- John Murphy's Market Message
- MurphyExplainsMarketAnalysis-Intermarket Analysis
- MurphyExplainsMarketAnalysis-Visual Analysis
- StockCharts.com
- Technical Analysis of the Financial Markets
- The Visual Investor
- VectorVest, Inc.
- Executive Premier Workshop
- One-Day Options Course
- OptionsPro
- Retirement Income Workshop
- Sure-Fire Trading Systems (VectorVest, Inc.)
- Trading as a Business Workshop
- VectorVest 7 EOD
- VectorVest 7 RealTime/IntraDay
- VectorVest AutoTester
- VectorVest Educational Services
- VectorVest OnLine
- VectorVest Options Analyzer
- VectorVest ProGraphics v6.0
- VectorVest ProTrader 7
- VectorVest RealTime Derby Tool
- VectorVest Simulator
- VectorVest Variator
- VectorVest Watchdog