

HOT TOPICS LIST
- MACD
- Fibonacci
- RSI
- Gann
- ADXR
- Stochastics
- Volume
- Triangles
- Futures
- Cycles
- Volatility
- ZIGZAG
- MESA
- Retracement
- Aroon
INDICATORS LIST
LIST OF TOPICS
PRINT THIS ARTICLE
by Ranjan Jha, CMT
The NASDAQ 100 index has shown remarkable strength going through this great recession. Will this pattern continue?
Position: N/A
Ranjan Jha, CMT
I am a member of the Market Technicians Association and manage a limited partnership investment club in Virginia. Always seek advice from your own Financial Advisor before acting on any method outlined here since every circumstance is different.
PRINT THIS ARTICLE
CHART ANALYSIS
Rise Of Technology
01/04/11 11:18:20 AMby Ranjan Jha, CMT
The NASDAQ 100 index has shown remarkable strength going through this great recession. Will this pattern continue?
Position: N/A
| This world has seen a lot since the market peak of October 2007. Failure of one kind or another for Bear Stearns, AIG, Lehman Brothers, General Motors, Chrysler, Citigroup, Bank of America, and many large and small mortgage outfits happened in a short duration. And on the international scene, a potential collapse of numerous European government debts and now, possibly, the euro is still a threat. Yet the NASDAQ 100 tracked by QQQQ (PowerShare QQQ) closes above its 2007 peak. This display of strength must mean something. |
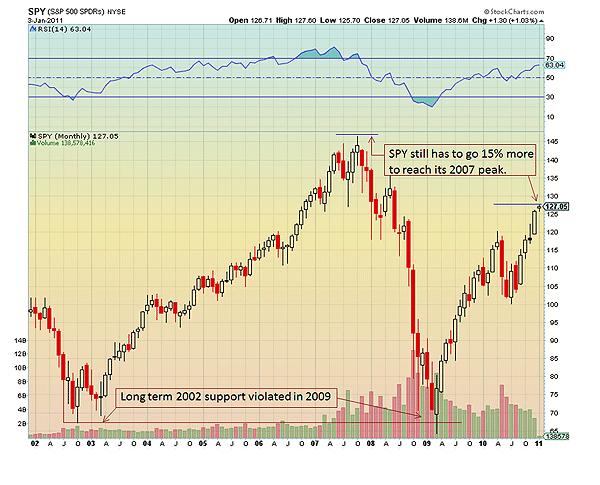
| Let's have a look at a monthly chart of Standard & Poor's 500 represented by SPY (S&P 500 SPDRs ETF) (Figure 1). From the October 2002 low of 77.07, SPY rose to 2007 high of 157.52. That was a rise of 104% and then it gave it all back and more by the March bottom of 2009. Since then it has recovered substantially but still needs to go about 15% more to see its 2007 peak. |
|
| FIGURE 1: S&P 500 SPDRs ETF (SPY), MONTHLY. It's still far away from the peak of its previous bull run. |
| Graphic provided by: StockCharts.com. |
| |
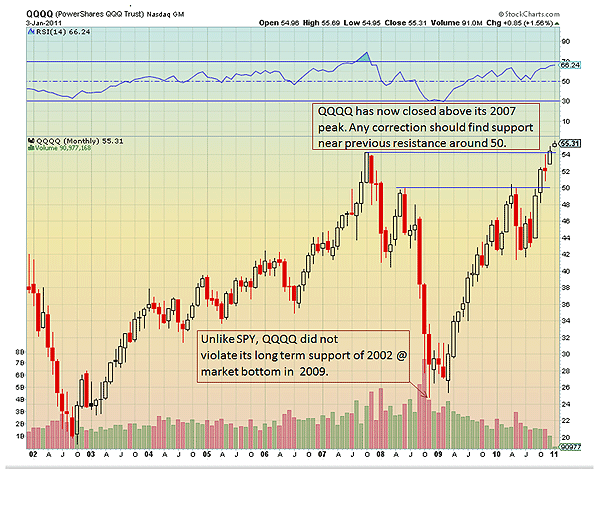
| Compared to SPY, NASDAQ 100 has shown a better performance for the last eight years. Figure 2 shows a monthly chart of QQQQ. From the low of 19.76 in October 2002 it rose to 55.07 in October 2007, a 179% rise. In addition, it didn't violate its 2002 lows at the 2008-09 market bottom. Now on the first trading day of 2011, it closed at 55.31, surpassing its 2007 peak of 55.07. One interesting point to note is that in 2002-07 bull run, it took QQQQ about four and half years to rise from 25 to 55. The same feat has been achieved in the current bull run in less than two years. QQQQ moved above a multiyear resistance at 50 in October 2010. That should provide support in the event of a sizeable correction. |
|
| FIGURE 2: POWERSHARES QQQ TRUST (QQQQ), MONTHLY. It just moved above its previous bull market high. |
| Graphic provided by: StockCharts.com. |
| |
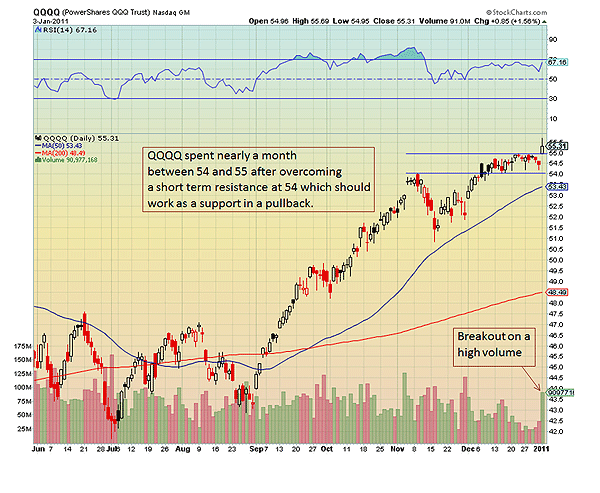
| A closer look at QQQQ's daily chart in Figure 3 shows that after moving above November resistance of 54, QQQQ traded in a tight trading range before breaking out on a high volume on January 3, 2011. That's bullish. In the event of any short-term pullback, this range of 54-55 should provide a significant support. In addition, the relative strength index (RSI) has continued to stay in a bullish range above 45-50 since September 2010. The price action on the daily chart confirms the bullish picture of the monthly chart. |
|
| FIGURE 3: POWERSHARES QQQ TRUST (QQQQ), DAILY. Consolidation and breakout on a high volume. |
| Graphic provided by: StockCharts.com. |
| |
| It's evident that NASDAQ 100 has performed relatively better than the overall market for several years now. The technical aspect of price action does not show any signs of weakness yet. There is a very good probability that technology sector represented by QQQQ will continue to outperform the overall market. One thing to keep in mind is that Apple and Google constitute about a quarter of QQQQ. You want to keep an eye on these two companies. They have helped QQQQ recover all of its losses with their cutting-edge products and technology. That fuel will be needed to propel NASDAQ 100 higher from this point on. |
I am a member of the Market Technicians Association and manage a limited partnership investment club in Virginia. Always seek advice from your own Financial Advisor before acting on any method outlined here since every circumstance is different.
| Address: | 2039 Stone Mill Drive |
| Salem, VA 24153 | |
| Phone # for sales: | 540-330-2911 |
| E-mail address: | ranjanjha@hotmail.com |
Click here for more information about our publications!
Comments
Date:�01/11/11Rank:�3Comment:�

Request Information From Our Sponsors
- StockCharts.com, Inc.
- Candle Patterns
- Candlestick Charting Explained
- Intermarket Technical Analysis
- John Murphy on Chart Analysis
- John Murphy's Chart Pattern Recognition
- John Murphy's Market Message
- MurphyExplainsMarketAnalysis-Intermarket Analysis
- MurphyExplainsMarketAnalysis-Visual Analysis
- StockCharts.com
- Technical Analysis of the Financial Markets
- The Visual Investor
- VectorVest, Inc.
- Executive Premier Workshop
- One-Day Options Course
- OptionsPro
- Retirement Income Workshop
- Sure-Fire Trading Systems (VectorVest, Inc.)
- Trading as a Business Workshop
- VectorVest 7 EOD
- VectorVest 7 RealTime/IntraDay
- VectorVest AutoTester
- VectorVest Educational Services
- VectorVest OnLine
- VectorVest Options Analyzer
- VectorVest ProGraphics v6.0
- VectorVest ProTrader 7
- VectorVest RealTime Derby Tool
- VectorVest Simulator
- VectorVest Variator
- VectorVest Watchdog