HOT TOPICS LIST
- MACD
- Fibonacci
- RSI
- Gann
- ADXR
- Stochastics
- Volume
- Triangles
- Futures
- Cycles
- Volatility
- ZIGZAG
- MESA
- Retracement
- Aroon
INDICATORS LIST
LIST OF TOPICS
PRINT THIS ARTICLE
by Donald W. Pendergast, Jr.
More than a few technicians are in agreement that the mighty Dow may be at or approaching a major trend reversal zone. Is this noticeable intraday domed top pattern one of the first confirmations of a bearish turn?
Position: N/A
Donald W. Pendergast, Jr.
Donald W. Pendergast is a financial markets consultant who offers specialized services to stock brokers and high net worth individuals who seek a better bottom line for their portfolios.
PRINT THIS ARTICLE
ROUND TOP & BOTTOM
Mini-Dow Intraday Domed Top Pattern
01/06/11 08:47:14 AMby Donald W. Pendergast, Jr.
More than a few technicians are in agreement that the mighty Dow may be at or approaching a major trend reversal zone. Is this noticeable intraday domed top pattern one of the first confirmations of a bearish turn?
Position: N/A
| When a meaningful intraday chart pattern appears in a futures contract that is also at and/or approaching a major trend reversal zone on its daily chart, wise technicians and traders will want to do some further investigation. Here's a brief look at the current situation in mini-Dow futures (@YM or YMH11), using an intraday 1,000-share volume chart and its corresponding daily chart. |

|
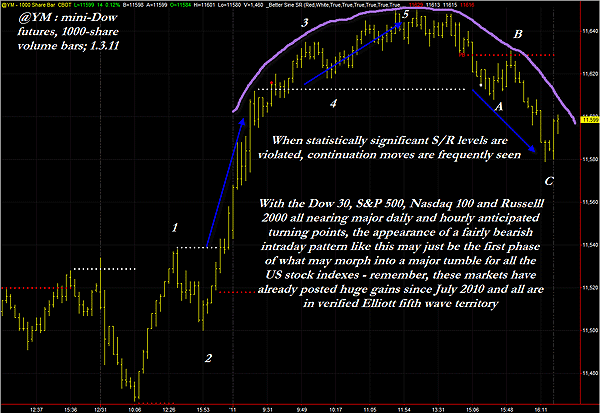
| FIGURE 1: MINI-DOW. Trading becomes a bit easier when two dissimilar methods combine to provide technicians with powerful price forecasting imagery; the domed top pattern occurs midway between the final phase of an Elliott five-wave impulse pattern and its subsequent Elliott three-wave corrective pattern. Placed in context against the mature Elliott five-wave pattern on the daily chart, this pattern speaks volumes about the likely direction of the mini-Dow in the near term. |
| Graphic provided by: TradeStation. |
| Graphic provided by: Barry Taylor's Better Sine SR indicator. |
| |
| Figure 1 is the fascinating domed top pattern on the 1,000-share volume chart (constructed using the combined day and evening sessions); check out that recent two-day run higher that began December 31 -- little wonder that traders were eager to take advantage of the remaining bullish sentiment that has been so evident since last summer. Prices pushed sharply higher at the US open (0930), bringing the mini-Dow back above 11,650 for the first time in a very long while, finalizing a fairly legible five-wave Elliott impulsive wave pattern, one in which the fifth wave is truncated. On my eight-minute YMH11 chart, I began to see a very likely distribution pattern, and sure enough, this 1,000-volume share chart also confirmed the distribution, especially when the long Barry Taylor Better Sine SR line (the white dotted resistance line that had now turned into potential support) failed to send prices back higher toward the intraday high -- even as the YM crashed right down through it, eventually tracing out a tentative three-wave Elliott corrective pattern. That's where the mini-Dow is on its intraday chart, but what about the daily chart? Is there a way in which we can put this intraday price action into a longer-term perspective, one that we can actually use? |

|
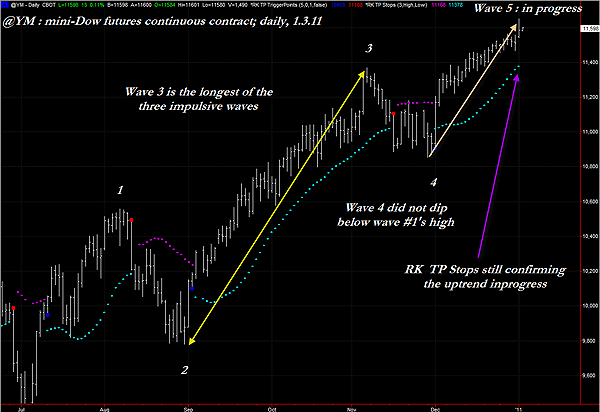
| FIGURE 2: MINI-DOW, DAILY. Five easy pieces? The one key variable on this chart is this: at what point does wave 5 finally end? Basic swing analysis can be of great help here, especially if we use a much shorter time frame (such as the one on the previous chart) to help get a head start on this anticipated trend reversal. |
| Graphic provided by: TradeStation. |
| Graphic provided by: Roy Kelly TrendPro RK TP Stops. |
| |
| Yes, and here's how. By looking at the mini-Dow daily chart (Figure 2), we see that the index is already in a very mature five-wave Elliott impulse pattern, one that may be nearing its terminal phase. I say "may" because the current fifth wave may just decide to keep going -- perhaps even deciding to stop near a nice round number like 12,000 or 12,250 or who knows where. What we do know is that the pattern has already met the qualifications needed to suggest that a reversal is becoming more likely every day. |
| Here's how you may want to play an impending bearish trend reversal: Watch for the intraday 1,000-volume share chart to rally toward point B near 11,630; if prices start to drop again, see if you can get short on a break of wave C's low near 11,579 and then plan to hold it for a trip down toward wave 2's low at or near 11,500. In the mini-Dow each index point is worth $5, so you're looking at a $395 move 3 -- if it plays out as anticipated. You might consider protecting such a short entry with a three- to four-bar trailing stop of the highs, looking to exit right near 11,500 -- which will likely serve as an important (but perhaps short-lived) interim support level in the index. Daily mini-Dow traders might look for a confirmed daily close below the Roy Kelly RK TP Stops (the aqua trailing stop on the chart) before initiating their own short positions. Right now, the stop is just below the 11,400 level but may actually continue to rise for a few more sessions, depending on how all of this technical action plays out. With the daily chart's wave 4 low all the way down at 10,854, well, you'll probably want to trail a RK TP Stop on the short side in this case as well. If we are at a major change in trend for the DJIA, the RK TP Stop may be able to help keep you in for the lion's share of what could be a very fast and ferocious move to lower price levels. |
| Elliott wave patterns can be very useful in the real world of trading, and you don't necessarily have to know all the myriad Elliott rules and regs in order to profit from the technique. You now have seen two Elliott wave patterns for the same market -- and they are both in agreement that a major turn could already be under way -- or soon will be. Trade wisely and carefully. Consider the risk-reward ratio (RR) of any trade scenario that you consider, going for at least a 2-to-1 ratio on the intraday chart and a 2.5 or even 3-to-1 RR on the daily chart. Big money can be made at major trend reversals, but you still need to excessive extreme self-discipline, no matter what, just in case the big move fails to appear when you thought it would. |
Donald W. Pendergast is a financial markets consultant who offers specialized services to stock brokers and high net worth individuals who seek a better bottom line for their portfolios.
| Title: | Writer, market consultant |
| Company: | Linear Trading Systems LLC |
| Jacksonville, FL 32217 | |
| Phone # for sales: | 904-239-9564 |
| E-mail address: | lineartradingsys@gmail.com |
Traders' Resource Links | |
| Linear Trading Systems LLC has not added any product or service information to TRADERS' RESOURCE. | |
Click here for more information about our publications!
Comments
Date: 01/11/11Rank: 5Comment:

Request Information From Our Sponsors
- StockCharts.com, Inc.
- Candle Patterns
- Candlestick Charting Explained
- Intermarket Technical Analysis
- John Murphy on Chart Analysis
- John Murphy's Chart Pattern Recognition
- John Murphy's Market Message
- MurphyExplainsMarketAnalysis-Intermarket Analysis
- MurphyExplainsMarketAnalysis-Visual Analysis
- StockCharts.com
- Technical Analysis of the Financial Markets
- The Visual Investor
- VectorVest, Inc.
- Executive Premier Workshop
- One-Day Options Course
- OptionsPro
- Retirement Income Workshop
- Sure-Fire Trading Systems (VectorVest, Inc.)
- Trading as a Business Workshop
- VectorVest 7 EOD
- VectorVest 7 RealTime/IntraDay
- VectorVest AutoTester
- VectorVest Educational Services
- VectorVest OnLine
- VectorVest Options Analyzer
- VectorVest ProGraphics v6.0
- VectorVest ProTrader 7
- VectorVest RealTime Derby Tool
- VectorVest Simulator
- VectorVest Variator
- VectorVest Watchdog
