HOT TOPICS LIST
- MACD
- Fibonacci
- RSI
- Gann
- ADXR
- Stochastics
- Volume
- Triangles
- Futures
- Cycles
- Volatility
- ZIGZAG
- MESA
- Retracement
- Aroon
INDICATORS LIST
LIST OF TOPICS
PRINT THIS ARTICLE
by Koos van der Merwe
The first rule of Elliott wave analysis is "The chart must look right."
Position: Sell
Koos van der Merwe
Has been a technical analyst since 1969, and has worked as a futures and options trader with First Financial Futures in Johannesburg, South Africa.
PRINT THIS ARTICLE
ELLIOTT WAVE
The First Rule
01/05/11 08:41:11 AMby Koos van der Merwe
The first rule of Elliott wave analysis is "The chart must look right."
Position: Sell
| When I look at Elliott wave counts of the Standard & Poor's 500, somehow the chart does not look right. My charts show a major Wave I and Wave II, and this tells me that the market is very definitely in a major bull market. However, trying to project a future count forward reminds me of Samuel Goldwyn's famous quote: "It is always difficult to forecast, especially the future." So, keeping this in mind, I must now look at two different wave counts in the bull market. I refuse to consider a bear market because that wave count is a totally different kettle of fish. |

|
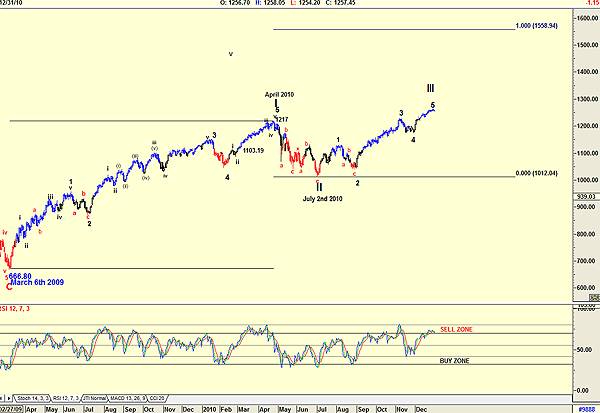
| FIGURE 1: S&P 500, DAILY |
| Graphic provided by: AdvancedGET. |
| |
| Figure 1 shows how the market rose in a Wave I from March 2009 until April 2010. Wave II bottomed on July 2, 2010. Since then, the S&P 500 has been in a Wave III. My chart suggests that Wave III has risen in five waves, and that it should be complete, with Wave IV down to follow. The problem is that Wave III should be larger than Wave I. If Wave III is less than Wave I, then Wave V will be less than Wave III. So the Elliott wave count of Figure 1 looks most unlikely, but it could occur, especially with the relative strength index (RSI) at overbought levels. |

|
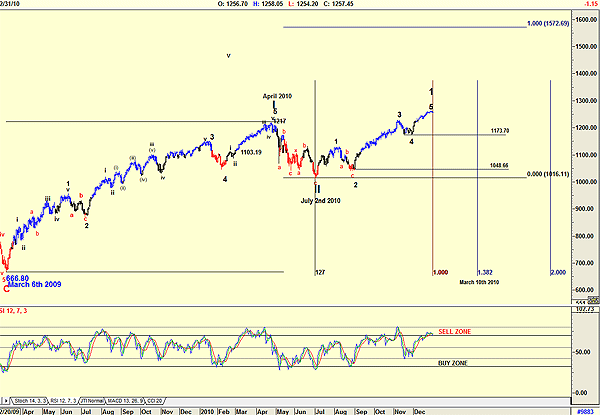
| FIGURE 2: S&P 500, DAILY. Here's another count. |
| Graphic provided by: AdvancedGET. |
| |
| Figure 2 suggests that the S&P 500 is in the process of completing Wave 1 of Wave III. This means that the Wave 2 of Wave III that now follows could retrace to the 1173.70 level, the low of the fourth wave of lesser degree. However, a wave 2 can retrace as much as 72%, and the chart will still follow the first rule. If the latter occurs, this means that we could see a correction to the 1048.66 level. This count looks more acceptable than the count of Figure 1, but it does mean that 2011 could start off with a falling market. Using a Fibonacci time count, this does suggest that Wave 2 of Wave III should bottom around about March 10, 2011. Do note on the chart that the level 1572.69. This is the level that is equal to the length of Wave I, and Wave III should not be less than this level for the chart to look right. Whatever the Elliott wave count turns out to be, it does look as though the start of 2011 will be bearish. It is the depth of that bear trend that is the uncertainty, with the S&P 500 either correcting to the 1173.70 level or the 1048.66 level. |
Has been a technical analyst since 1969, and has worked as a futures and options trader with First Financial Futures in Johannesburg, South Africa.
| Address: | 3256 West 24th Ave |
| Vancouver, BC | |
| Phone # for sales: | 6042634214 |
| E-mail address: | petroosp@gmail.com |
Click here for more information about our publications!
Comments
Date: 01/13/11Rank: 5Comment:

Request Information From Our Sponsors
- StockCharts.com, Inc.
- Candle Patterns
- Candlestick Charting Explained
- Intermarket Technical Analysis
- John Murphy on Chart Analysis
- John Murphy's Chart Pattern Recognition
- John Murphy's Market Message
- MurphyExplainsMarketAnalysis-Intermarket Analysis
- MurphyExplainsMarketAnalysis-Visual Analysis
- StockCharts.com
- Technical Analysis of the Financial Markets
- The Visual Investor
- VectorVest, Inc.
- Executive Premier Workshop
- One-Day Options Course
- OptionsPro
- Retirement Income Workshop
- Sure-Fire Trading Systems (VectorVest, Inc.)
- Trading as a Business Workshop
- VectorVest 7 EOD
- VectorVest 7 RealTime/IntraDay
- VectorVest AutoTester
- VectorVest Educational Services
- VectorVest OnLine
- VectorVest Options Analyzer
- VectorVest ProGraphics v6.0
- VectorVest ProTrader 7
- VectorVest RealTime Derby Tool
- VectorVest Simulator
- VectorVest Variator
- VectorVest Watchdog
